There are no active warnings for this location.
Weather Maps
Daily Forecast
An unstable airmass is bringing cool winds and showers to WA's centre. Showers along the NSW and Qld coasts with moist winds. The odd light shower over the NT's eastern Top End. Dry elsewhere with a high pressure ridge.
Latest Warnings
AUS

Latest News

Climate Updates
Weather in Business

Latest News

Today, 1:42AM UTC
Unrelenting high pressure dominating Australia’s weather
A stubborn area of high pressure has been entrenched to the south of Australia over the last few weeks, causing a lengthy run of repetitive weather across the country. Weather systems in Earth’s mid-latitudes typically move from west to east. This includes the high and low pressure systems, cold fronts and low pressure troughs that pass over and near the southern half of Australia. This alternating sequence of high and low pressure systems is what causes changes in the weather across Australia’s southern states, from warm to cold, dry to wet or calm to windy. Meteorologists keep a close eye on weather systems approaching Australia from the west to know what changes in the weather are on the horizon. In a typical weather pattern, each individual synoptic feature (e.g. a high pressure system or cold front) would take around 3 to 5 days to pass over the Australian region. However, these synoptic features can sometimes become stuck in place. The most common cause of a stagnant weather pattern in the mid-latitudes is a blocking high pressure system. As the name suggests, this refers to a region of high pressure that sits in one place and blocks the passage of other synoptic features. Blocking high pressure systems can occur anywhere in the mid-latitudes in both the Southern and Northern Hemispheres. Blocking highs have been responsible for intense heatwaves, flooding and other types of extreme weather, but they can also cause long spells of pleasant weather. A blocking high has been lingering to the south of Australia over the last few weeks. In April, the mean sea level pressure off the south coast of WA was more than 10 hPa above average. This has continued into the first week of May, with mean sea level pressure to the south of Australia running more than 20 hPa above average in the week ending on May 4. Images: Mean sea level pressure anomaly during April 2024 (top) and the seven days ending on May 4, 2024 (bottom). Source: NOAA / PSL Because air circulates high pressure systems in an anti-clockwise direction in the Southern Hemisphere, blocking highs centred to the south of the country typically cause: Persistent onshore winds in eastern Australia, providing plenty of moisture for rain and thunderstorms in NSW and Qld Dry offshore winds along the west coast of Australia, making rain less likely Mild temperatures and less snow in southern Australia due to a lack of strong cold fronts Reduced rainfall in the south of SA and Vic, and western and southern Tas, also due to a lack of strong cold fronts April’s rainfall distribution across Australia reflected the dominant influence of the blocking high pressure to the south of the country. Rainfall was below average in large areas of WA, SA and western Tas, while parts of NSW and Qld were much wetter than normal. Image: Observed rainfall deciles in April 2024. Source: Bureau of Meteorology The first fortnight of May is also turning out to be very wet for parts of eastern Australia due to the lingering blocking high centred to the south of Australia. Sydney registered more than 6 mm of rain on each of the first six days in May. The last time there were six days this wet in Sydney was in 2022, also under the influence of a blocking high. The map below shows the predicted rainfall over the next seven days, with widespread and heavy falls anticipated to continue in Australia’s eastern states. Image: Forecast accumulated rain during the seven days ending on Monday, May 13, 2024. The presence of the unrelenting high pressure to the south of Australia also makes early-season snow less likely on Australia’s mountains in the first half of May.
Today, 12:38AM UTC
Driest 12 months on record for big chunk of WA
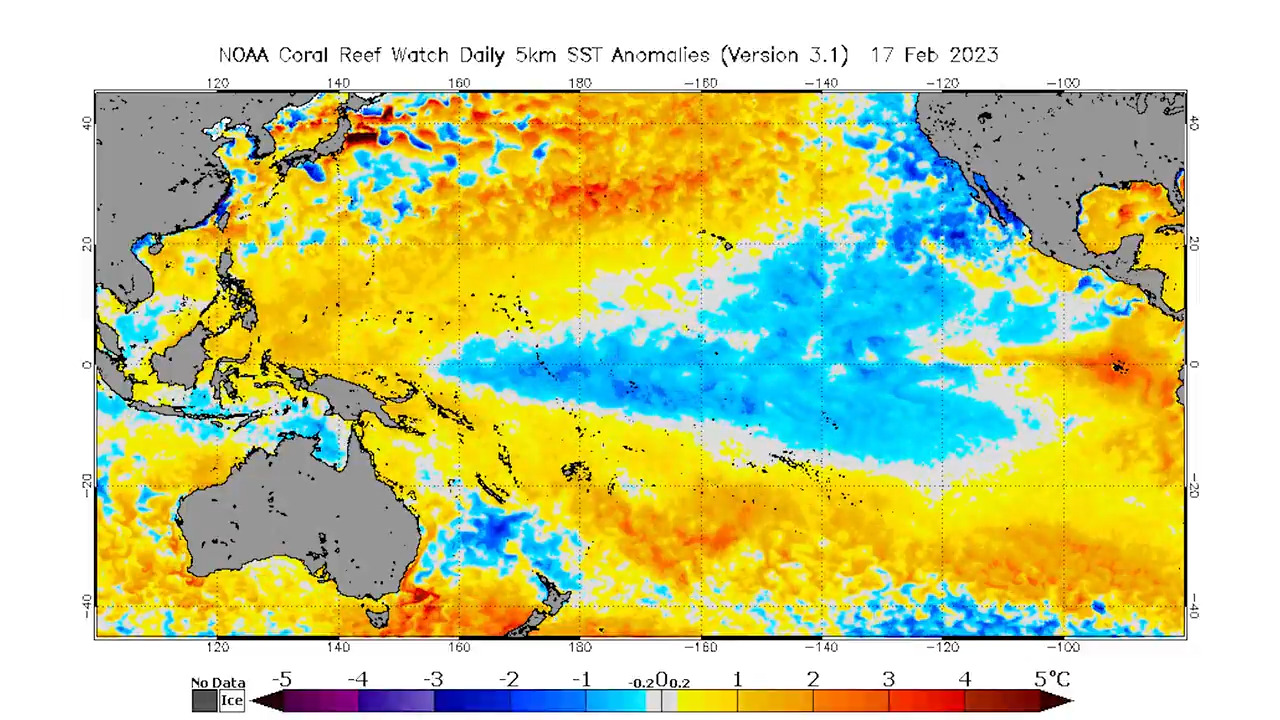
If you're wondering why the long overdue rain that fell in parched southwest WA last week was so welcome, take a look at the chart below. The chart shows rainfall deficiencies Australia-wide in the 12 months from the beginning of May 2023 to the end of April 2024. Source: BoM. As you can see, small parts of NSW, SA, and Vic all experienced serious deficiencies or worse, while a significant portion of Tasmania – including the area in the southeast around Hobart – was also very dry. But the eye is immediately drawn to Western Australia, where a huge area of the state's west endured significant rainfall deficiencies over the last 12 months. The BoM issued its monthly drought statement this week, and rainfall was again below average for western, southern and central parts of Australia in April. One of the charts that illustrates the ongoing situation in the west is the soil moisture map. When you see that some areas have seen the lowest soil moisture on record, it explains why even hardy native species like WA’s iconic Jarrah trees have begun to die off in some areas. Source: BoM. The next chart below shows the WA rain that fell in the week up to May 6, which included the heaviest May falls in 82 years in the town of Wandering, about 120 km southeast of Perth. As mentioned, that rainfall event was welcomed by locals but much more will be needed over the traditionally wet winter period. Source: BoM. Here's one more chart that should give reason for hope for residents of the southwest. It shows sea surface temperature anomalies in the waters off the coast. Source: BoM. With warmer than usual waters, there's a greater chance of storms and heavy downpours when moisture-laden winter cold fronts start sweeping northward from southern waters. The positive IOD isn't all bad news for the southwest either. While it tends to point towards a drier winter (and worse snow season) for the southeast, the southwest can see more rain than average. Image: How the positive IOD affects rainfall in Australia.

06 May 2024, 2:04AM UTC
500km line of storms sweeping across the Goldfields,WA
Over 32 thousand lightning strikes hit the Kalgoorlie region on Sunday and Monday, with more rainfall to come at the end of this week for the state’s southwest. The image below shows a 500km line of thunderstorms stretching between Leinster and Salmon Gums on Monday morning as the sun rises. Image: Himawari-9 satellite images for the three hours leading up to 8:20am AWST on Monday, May 6. There have not been any huge rain totals recorded in the sparse gauges in the region, despite the storm activity. Unfortunately, Kalgoorlie has not recorded any rainfall as the rainfall observations became faulty just before the storm. While not much rain has been recorded from these storms yet, they have been particularly active with lightning. Weatherzone’s Total Lightning Network recorded just over 32 thousand lightning strikes in a day in the Kalgoorlie region. This rain and storm event is being caused by a low-pressure trough on the surface and an upper-level low pressure system. The image below shows the upper low-pressure system passing through southwest WA. Image: 500 hPa temperature and height at 2pm AWST on Monday, May 6, according to Access-G This low will weaken on Tuesday and continue moving east, moving into SA by mid-week, easing the rainfall and thunderstorms in the area from Tuesday. Looking ahead, another burst of wet weather is forecast from Friday into the weekend for the states southwest as surface low pressure system sweeps across the state. The map below shows the rainfall forecast for the next week by one computer model, showing the rainfall expected in the Kalgoorlie area at the beginning of the week and the wet end to the week in the state’s southwest. Images: Accumulated rainfall forecast for the week leading up to 8am AWST on Monday, May 13, according to Access-G (Top) and ECMWF (bottom) You can see there is still some uncertainty regarding where and how much rain will fall in the southwest at the end of the week. We will keep you updated.
Weather in Business

23 Apr 2024, 12:07AM UTC
Wind returning to southeastern Australia
After a prolonged period of light winds, a surge of powerful winds and cool air will push through southeastern Australia during the next 48 hours. As we wrote about last week the National Electricity Market (NEM) saw very low wind power generation during the seven days leading up to Thursday, April 18, with the daily wind generation having been under 41 GWh/day for this period. Wind power has improved slightly during the past week, with wind power increasing for a few days over last weekend. The chart below shows that the winds across the NEM have already increased in response to a cold front approaching SA and Vic on Tuesday. The increase in wind power is associated with a cold front sweeping across southeastern Australia, after a stubborn high-pressure system forced many cold fronts south for over a week. The map below shows the cold front marching across the Bight, approaching SA on Tuesday morning. You can also see a broad area of speckled cloud in the Bight, which is a tell-tale sign that a large mass of cold polar air has broken away from the Antarctic region and is venturing into the relatively warm mid-latitudes. Image: Himawari-9 satellite image at 9:30am AEST on Tuesday, April 23. Northwesterly winds will continue to strengthen ahead of the cold front on Tuesday in SA and Vic before a strong southwesterly change hits Adelaide on Tuesday afternoon and Melbourne in the evening. The images below show the wind gust forecast for Tuesday and Wednesday afternoon. Image: Instantaneous wind gust forecast at 1pm AEST on Tuesday (top) (bottom)and Wednesday, April 23 and 24, according to ECMWF While most of this wind should hit the wind power ‘sweet spot’, cut outs could occur at southeastern Vic and southern NSW wind farms late Tuesday into Wednesday. Generally, cut outs occur when wind speeds exceed 90km/h (25 m/s), which is when the wind turbines are turned off to prevent damage. In the image above you can see the front and associated southerly change moving up the NSW coast on Wednesday, hitting Sydney on Wednesday afternoon. Winds will then become light later this week as another high-pressure system moves into the Bight. Cool change coming Ahead of this change, much of southeastern Australia has experienced pleasant autumnal weather, with Sydney’s temperature for the next two days reaching 27°C. However, there will be a large temperature contrast ahead and behind the cold front in the next few days. The image below shows forecast air temperatures around 1.5km above sea level on Wednesday morning, showing the cool airmass moving over parts of SA, VIC, Tas. Behind the cold front strong southwesterly winds will cause temperatures to plummet to around 2-3°C below average across southern Australia; Melbourne and Adelaide's temperature dropping to around 16-18°C for several days following the front. Hobart’s temperature will drop from 22°C on Tuesday to 15°C on Wednesday. Sydney’s temperature will go from 5°C above average on Wednesday to average on Thursday. The coolest air will move over Tas, bringing snow to the alpine region there. Looking ahead, temperatures will recover later this week ahead of another cold front and burst of wind power early next week.
18 Apr 2024, 3:20AM UTC
Generation gone with the wind
A weeklong stretch of low wind power was broken on Wednesday evening, as a weak cold front marched across southern Australia. The chart below shows that the National Electricity Market (NEM) has endured a weeklong stretch of low wind generation, with wind power providing around 6% of the NEM’s electricity, down from last year’s average of 13.1% (Mon, April 15 to Wed, April 17). The daily wind generation has been under 41 GWh/day for the last seven days leading up to Thursday, April 18. The calmest winds occurred on Sunday, April 14 with only 24 GWh/day produced or 4.6% of grid demand. To put this in perspective, the average daily wind generation during the last year up to Wednesday, April 17, 2024, was 71 GWh/day, according to data from the open NEM. This prolonged period of low wind was caused by blocking high pressure systems sitting over southern Australia, forcing cold fronts or strong wind further south. The image below shows the Mean Sea Level Pressure chart on the calmest day, Sunday, April 14, with high pressure stubbornly sitting over the southern half of the country. Image: Mean Sea Level Pressure Analysis at 4am AEST on Sunday, April 14. Source: Bureau of Meteorology. As we mentioned earlier today, a positive Southern Annular Mode (SAM) has led to consistent high pressure systems positioned over latitudes well south of Australia during the first three months of the year and during this week. This has kept cold fronts south of the mainland, and even south of Tasmania. READ MORE: WHAT IS THE SAM? The period of light winds ended abruptly on Wednesday evening, with WattClarity reporting that wind production peaking above 3,000 MW at 9:10pm AEST. The increased wind power on Wednesday night, was caused by a couple of factors; A weak cold front swept across the southeast on Wednesday, bringing stronger winds. A very shallow temperature inversion formed in the early evening protecting the surface from the stronger winds, but the wind turbine hub-height (150 metres above the ground) winds remained strong at around 28-38 km/h in SA. Temperature inversions form at night when the ground cools quicker than the air above it, meaning that the temperature increases with height for a thin layer of the atmosphere. During autumn, the temperature inversions are commonly shallow meaning that while the wind could be weak at the surface, the hub heights could continue to experience strong winds. A similar phenomenon could happen again tonight across southern Australia, with another cold front passing across the south. Looking ahead, light winds are expected to continue from Friday as a stubborn high-pressure system builds over the Bight until early to mid-next week.