There are no active warnings for this location.
Weather Maps
Daily Forecast
Showers & storms are scattering across southwest QLD. western NSW & far northern VIC with a pool of cold air. Showers along the eastern seaboard & the NT's northeast in humid easterly winds. A front is bringing cool winds & showers to WA's south. A high is keeping elsewhere dry.
Latest Warnings
AUS

Latest News

Climate Updates
Weather in Business

Latest News

Today, 3:48AM UTC
Heaviest May rainfall in 82 years recorded in WA town
Parched areas of southwest WA have finally seen some rain this week, with Wandering recording its highest May rainfall in more than 82 years and the most rainfall the town has seen in 13 months. The rain event began on Wednesday, with Bunbury recording a 2-day total of 55 mm to 9am on Friday, May 3, which is the most rain the town has seen since August 2023 and a 3 year high for May. Cowaramup also saw their largest rainfall totals in two and a half years, with 60 mm recorded during the 24 hours to 9am on Thursday, May 2. The rainfall intensified on Thursday as severe thunderstorms and a cold front swept across the region, with some towns recording more than 100 mm of rain in a day in the southwest of the state. Image: 24-hour rainfall to 9am on Friday, May 3. Source: Bureau of Meteorology The largest falls in the 24 hours leading up to 9am on Friday, May 3 were; Brookdale Siding, which saw 120mm Wandering recorded 45.6mm, its wettest May day in more than 24 years, and the most rainfall the site has seen in 13 months. This rainfall is just under a month’s worth of rain. Dwellingup saw 39.4mm Collie East recorded 38mm, a quarter of its monthly average Bunbury observed 35.6mm, its highest May rainfall in three years Karnet hasn’t seen rainfall like this since July 2022, with 35mm falling in the guage. Much of this rain fell in a matter of hours as severe thunderstorms lashed the southwest of the state. The areas that saw the most intense rainfall on Thursday, May 2 were: Brookdale Siding saw 66 mm in the 3 hours to 5:45pm, which has only a 1% chance of occurring in any given year Bunbury recorded more rainfall in an hour than it has in the last 7 months, with 17.6mm falling in the hour leading up to 11am. During the 7 months before May 2024, the site has seen only 15.8mm. Mount William recorded 45.4 mm in the 1 hour to 1:05pm. The video below shows a waterspout off the Mandurah coast in WA on Thursday, May 2. Video: Waterspout and storm clouds off Mandurah coast WA on Thursday, May 2. Credit: tomproudfoot The rainfall that has fallen over the past two days has been very welcome for those in the southwest suffering from the driest 7-month period on record. Image: Rainfall anomalies between 1 October 2023 to 30 April 2024, source Bureau of Meteorology. While this rainfall was not drought-breaking, it has been a great start to May and will go a long way to reducing these rainfall deficiencies in some areas.
Today, 1:04AM UTC
Rain and storms spreading across NSW
A three-day soaking has begun in NSW, with rain and thunderstorms expected to spread across most of the state over the next 72 hours. An upper-level cut-off low will pass over NSW from west to east between Friday and Sunday. As this upper low crosses NSW, it will interact with moisture-laden air to produce widespread rain and thunderstorms across the state. Video: 500 hPa temperature and height from the ECMWF-HRES model, showing the upper-level low passing over NSW between Friday and Sunday. Storms began to develop near the NSW-SA border on Thursday and became more widespread in far western NSW through Thursday night into Friday morning, in response to the upper-level low. There were also showers along the coast due to a sustained feed of moisture-laden onshore winds. Some of the notable rainfall totals during the 24 hours ending at 9am on Friday included: 46 mm at Greenwell Point 39 mm at Currarong 28 mm at Evans Head and Manly 23 mm at Owen Downs 20 mm at Borrona Downs, its heaviest rain in three months 13 mm at Fowlers Gap, close to one month’s rain at this time of year Rain and storms will continue to spread towards the east on Friday and over the weekend, affecting parts of every district in NSW, the ACT and parts of southern and central Qld. Image: Forecast daily rainfall between Friday and Sunday, according to the ECMWF-HRES model. The maps above show the predicted accumulated rain over the next three days. Most of the heaviest falls will initially occur over western and central inland NSW, before increasing along the coast from Sunday. Widespread falls of 20 to 40 mm are likely in western, central and northern NSW and parts of southern and central Qld between Friday and Sunday, with pockets of heavier rain. Some places along the NSW coast could see more than 100 mm by early next week, most likely around the Sydney and Illawarra regions. Image: Forecast accumulated rain between Friday and Sunday, according to the ECMWF-HRES model. Drier weather will return to most of western NSW by the start of next week, although rain will continue along the coast and adjacent ranges into the first half of next week. This system has the potential to cause severe thunderstorms and flooding, so be sure to stay up to date with the latest warnings in your area.

02 May 2024, 7:05AM UTC
Will another positive Indian Ocean Dipole brew in 2024?
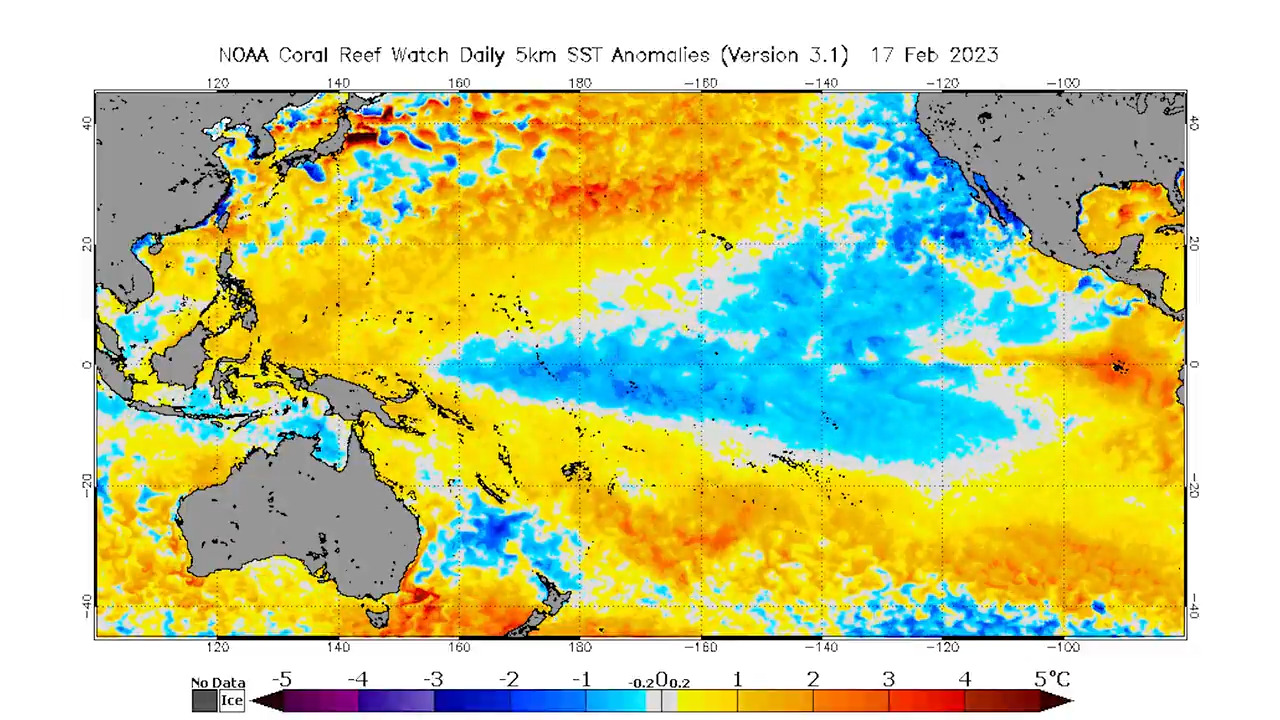
Signs are pointing to the second consecutive positive Indian Ocean Dipole (IOD) developing in the next few months. However, May is shaping up to be a time to make-or-break this event. What is a positive IOD? The IOD is a coupled ocean-atmosphere climate driver that changes the circulation patterns over the Indian Ocean. A positive IOD occurs when colder waters are upwelled (brought from below to the surface) in the eastern Indian Ocean near Jakarta, forcing warmer waters to travel west, where they build up near Africa. The cold water in the east reduces atmospheric moisture, leading to clearer skies and stronger southeasterly winds in the eastern Indian Ocean and the Australian continent. These winds then help to continue the upwelling of more cold water. Meanwhile, near Africa, warm waters boost convection, increasing rain and thunderstorms, helping draw more air in from the east. This positive feedback loop allows an established positive IOD to become stronger and self-sustaining. Positive IOD events typically reduce the amount of moisture that flows from northwest Australia to the southeast of the country. This leads to clearer skies, reduced rainfall, and increased daytime temperatures during winter and spring. Minimum temperatures typically increase in spring throughout Australia with a positive IOD, but they decrease in the southeast during winter under clearer skies, increasing the occurrence of frosts. Recent positive IOD events were in 2019 and last year in 2023, both of which featured very dry periods in late winter to mid-spring. Note that if a positive IOD forms this year, it will be the first time since records began in 1960 that we have seen two consecutive positive IOD events. Image: Standard rainfall anomaly over Australia from August to October 2023 as the positive Indian Ocean Dipole developed. Source: Climate Change Institute, University of Maine How close are we to a positive IOD? Like the Niño3.4 index used to monitor the El Niño Southern Oscillation in the Pacific Ocean, the Indian Ocean has an equivalent index, simply named the IOD Index. This index compares the relative ocean temperatures in the western (near the Horn of Africa) and the eastern (near Jakarta, Indonesia) Indian Ocean. When this index is above +0.4°C for at least 3 consecutive months, it is a sign that a positive IOD is underway. Over the past 7 weeks, the IOD Index has been above +0.4°C and is currently sitting at a value of +0.68°C. If the index keeps this up over the next 5 or so weeks, it is likely that a positive IOD event will be declared. How certain is it that a positive IOD will form? A critical time in the development of this IOD event is approaching in mid-to-late May. This event is a strong pulse of the Madden-Julian Oscillation, a pulse of tropical activity that circumnavigates the globe near the equator. During an active pulse, tropical activity increases, and the result can alter both ocean and atmospheric patterns. It is well documented and researched that this kind of tropical activity can act for or against particular phases of the IOD. Over an active area of tropical activity, especially if a tropical cyclone forms, air is constantly rising, and cold water is helped to upwell underneath. If this converging air and cold-water upwelling occurs in certain locations in the Indian Ocean, it can amplify or dampen the establishing IOD circulation. For example, if a tropical cyclone develops in the Bay of Bengal during the months of April or May, there is a very high likelihood that a positive IOD event will occur in that year. This is because it draws moisture away from the 'upwelling zone' labelled below, setting up the circulation necessary for a positive IOD. Around mid-May, a pulse of the MJO will pass over the eastern Indian Ocean. If significant tropical activity occurs near India or near Australia, this positive IOD event will become far more likely to occur. Conversely, if significant activity occurs over Indonesia, and specifically in the 'upwelling zone' near Jakarta, it may act to hinder the formation of the positive IOD. The occurrence of this tropical interference leads to the 'autumn predictability barrier', a term to reflect how climate driver forecasts at this time of year have reduced accuracy. Any tropical activity forming in particular locations in the Indian Ocean, as well as other ocean basins, may interrupt the establishing circulation, and lead to a sudden shift in climate driver expected for the remainder of the year. This barrier applies in the Pacific Ocean with the El Niño Southern Oscillation for the same reasons. So far in 2024, there are strong signs that a positive IOD is forming, with southeasterly winds in the east, and warm waters built up in the west. However, it is too soon to say with certainty that one will develop this year, but we should have a good idea if it will by the end of the month.
Weather in Business

23 Apr 2024, 12:07AM UTC
Wind returning to southeastern Australia
After a prolonged period of light winds, a surge of powerful winds and cool air will push through southeastern Australia during the next 48 hours. As we wrote about last week the National Electricity Market (NEM) saw very low wind power generation during the seven days leading up to Thursday, April 18, with the daily wind generation having been under 41 GWh/day for this period. Wind power has improved slightly during the past week, with wind power increasing for a few days over last weekend. The chart below shows that the winds across the NEM have already increased in response to a cold front approaching SA and Vic on Tuesday. The increase in wind power is associated with a cold front sweeping across southeastern Australia, after a stubborn high-pressure system forced many cold fronts south for over a week. The map below shows the cold front marching across the Bight, approaching SA on Tuesday morning. You can also see a broad area of speckled cloud in the Bight, which is a tell-tale sign that a large mass of cold polar air has broken away from the Antarctic region and is venturing into the relatively warm mid-latitudes. Image: Himawari-9 satellite image at 9:30am AEST on Tuesday, April 23. Northwesterly winds will continue to strengthen ahead of the cold front on Tuesday in SA and Vic before a strong southwesterly change hits Adelaide on Tuesday afternoon and Melbourne in the evening. The images below show the wind gust forecast for Tuesday and Wednesday afternoon. Image: Instantaneous wind gust forecast at 1pm AEST on Tuesday (top) (bottom)and Wednesday, April 23 and 24, according to ECMWF While most of this wind should hit the wind power ‘sweet spot’, cut outs could occur at southeastern Vic and southern NSW wind farms late Tuesday into Wednesday. Generally, cut outs occur when wind speeds exceed 90km/h (25 m/s), which is when the wind turbines are turned off to prevent damage. In the image above you can see the front and associated southerly change moving up the NSW coast on Wednesday, hitting Sydney on Wednesday afternoon. Winds will then become light later this week as another high-pressure system moves into the Bight. Cool change coming Ahead of this change, much of southeastern Australia has experienced pleasant autumnal weather, with Sydney’s temperature for the next two days reaching 27°C. However, there will be a large temperature contrast ahead and behind the cold front in the next few days. The image below shows forecast air temperatures around 1.5km above sea level on Wednesday morning, showing the cool airmass moving over parts of SA, VIC, Tas. Behind the cold front strong southwesterly winds will cause temperatures to plummet to around 2-3°C below average across southern Australia; Melbourne and Adelaide's temperature dropping to around 16-18°C for several days following the front. Hobart’s temperature will drop from 22°C on Tuesday to 15°C on Wednesday. Sydney’s temperature will go from 5°C above average on Wednesday to average on Thursday. The coolest air will move over Tas, bringing snow to the alpine region there. Looking ahead, temperatures will recover later this week ahead of another cold front and burst of wind power early next week.
18 Apr 2024, 3:20AM UTC
Generation gone with the wind
A weeklong stretch of low wind power was broken on Wednesday evening, as a weak cold front marched across southern Australia. The chart below shows that the National Electricity Market (NEM) has endured a weeklong stretch of low wind generation, with wind power providing around 6% of the NEM’s electricity, down from last year’s average of 13.1% (Mon, April 15 to Wed, April 17). The daily wind generation has been under 41 GWh/day for the last seven days leading up to Thursday, April 18. The calmest winds occurred on Sunday, April 14 with only 24 GWh/day produced or 4.6% of grid demand. To put this in perspective, the average daily wind generation during the last year up to Wednesday, April 17, 2024, was 71 GWh/day, according to data from the open NEM. This prolonged period of low wind was caused by blocking high pressure systems sitting over southern Australia, forcing cold fronts or strong wind further south. The image below shows the Mean Sea Level Pressure chart on the calmest day, Sunday, April 14, with high pressure stubbornly sitting over the southern half of the country. Image: Mean Sea Level Pressure Analysis at 4am AEST on Sunday, April 14. Source: Bureau of Meteorology. As we mentioned earlier today, a positive Southern Annular Mode (SAM) has led to consistent high pressure systems positioned over latitudes well south of Australia during the first three months of the year and during this week. This has kept cold fronts south of the mainland, and even south of Tasmania. READ MORE: WHAT IS THE SAM? The period of light winds ended abruptly on Wednesday evening, with WattClarity reporting that wind production peaking above 3,000 MW at 9:10pm AEST. The increased wind power on Wednesday night, was caused by a couple of factors; A weak cold front swept across the southeast on Wednesday, bringing stronger winds. A very shallow temperature inversion formed in the early evening protecting the surface from the stronger winds, but the wind turbine hub-height (150 metres above the ground) winds remained strong at around 28-38 km/h in SA. Temperature inversions form at night when the ground cools quicker than the air above it, meaning that the temperature increases with height for a thin layer of the atmosphere. During autumn, the temperature inversions are commonly shallow meaning that while the wind could be weak at the surface, the hub heights could continue to experience strong winds. A similar phenomenon could happen again tonight across southern Australia, with another cold front passing across the south. Looking ahead, light winds are expected to continue from Friday as a stubborn high-pressure system builds over the Bight until early to mid-next week.