There are no active warnings for this location.
Weather Maps
Daily Forecast
Showers on the northeast QLD coast in gusty onshore winds. Brisk winds with a front are causing showers over western & southern TAS. High pressure keeps elsewhere dry & mostly clear.
Latest Warnings
AUS

Latest News

Climate Updates
Weather in Business

Latest News

22 May 2024, 3:46AM UTC
May to become Earth's 14th consecutive month of record ocean warmth
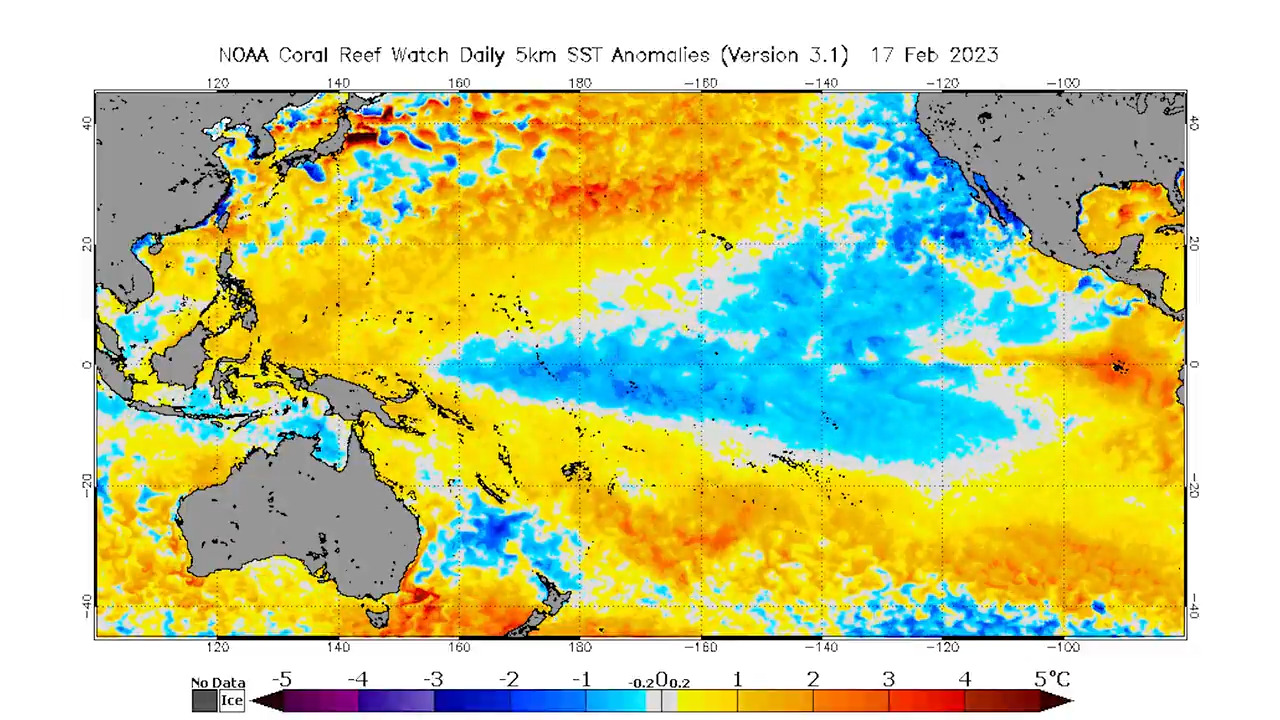
May is on track to become the 14th consecutive month of record-breaking global ocean warmth, despite clear signs of La Niña emerging in the tropical Pacific Ocean. Global sea surface temperatures have broken records in every month since April 2023 and May is now on track to become the 14th consecutive month to set a record for ocean warmth. The graph below shows daily global sea surface temperatures between 1979 and 2024 according to the ECMWF’s highly regarded ERA5 dataset. Image: Daily global sea surface temperatures between 1979 and 2024 using ERA5 data. Source: ECMWF/C3S The thick dark line near the top of the graph is 2024 to date and the orange line below it is 2023. As you can see, all of 2024 and most of 2023 have been warmer than any other similar period on record, by a clear margin. May 2024 is clearly warmer than May 2023 and is on track to become the 14th month in a row to set a new global sea surface temperature record. The map below shows how ocean warmth is currently being distributed across the planet, with orange and red colours showing areas that are warmer than average for this time of year. Blue shading represents areas that are cooler than average for late May. Image: Global sea surface temperature anomaly on May 20, 2024, according to the OISST V2.1 dataset. Source: ClimateReanalyzer.org While there are some broad areas of blue on the map above, the red and orange colours are more dominant and in some places more intense. One of the notable areas of excessive warmth is the North Pacific Ocean between Japan and North America. This broad area of abnormally warm water is associated with a negative phase of the Pacific Decadal Oscillation (PDO). There is also a small tongue of cooler-than-average water in the eastern tropical Pacific Ocean, associated with the early phase of a developing La Niña pattern. While a mature La Niña can noticeably reduce the global ocean temperature, this developing La Niña pattern is currently too small to have a significant influence of global average sea surface temperatures. The reasons for this 14-month run of record-breaking global ocean warmth are an area of active research, although some of the most likely contributing factors include: Ongoing warming due to climate change Additional warming from natural variability (e.g. a negative PDO) Enhanced ocean warming due to reduced air pollution (e.g. reduction in sulphur dioxide emissions from ships) With temperatures currently running above average over so much of the Earth’s oceans, it is possible that this record-breaking run of heat will persist even further into 2024.
22 May 2024, 2:07AM UTC
Adelaide facing driest May on record
It tried to rain on Sunday night, and the clouds even managed to squeeze out 0.6 mm of rainfall by 9 am Monday, but Adelaide's desperately dry May continues with no immediate end in sight. That paltry 0.6 mm is Adelaide's total rain for May 2024 to date and snapped a 29-day dry spell which came on the back of extremely dry months in March and April and a totally rain-free February. May is usually one of Adelaide's wettest months with an average of 67.9 mm at the city's West Terrace/ngayirdapira site in records stretching back to 1839 – a significant period of data considering the city was only founded in 1836. Adelaide's lowest May rainfall on record was 2.6 mm in 1934 at West Terrace/ngayirdapira, and 8.2 mm in 2005 at the Kent Town weather station, which served as the city's official weather station for 40 years from 1977 to 2017. Whichever way you look at it, Adelaide is facing the distinct possibility of its driest May in 185 years of records. So will it rain before June? Almost certainly not in the week from this Wednesday to next Wednesday, no. Beyond that period, there's a glimmer of hope towards the end of the month. The BoM's ACCESS-G model shows moisture associated with a cold front flicking the southeast of SA with the chance of thunderstorms. But this is a very marginal system that could slide too far south to impact Adelaide. Image: The charts suggest some hope of rain, but it definitely wouldn't hurt to touch some wood, cross your fingers or do a rain dance. Meanwhile as dry lawns crackle underfoot in the suburbs, the combined capacity of Adelaide's water storages is at 45%, compared to 56% on this day last year. It's relatively normal for dams to be low at this time of year after the traditionally dry summer and early autumn period, but South Australians will have their fingers and toes crossed for substantial rains in the coming winter months.

21 May 2024, 4:39AM UTC
NSW Central Coast cops seven-week soaking
Parts of the Central Coast region in NSW have received more than half a year’s worth of rain in the last seven weeks. Australia’s 10th most populated urban area, located about one hour north of Sydney and to the south of Newcastle, has been very wet since the start of April. While Sydney has received about 400 mm over the past seven weeks, some areas on the Central Coast have picked up 700 mm over the same period. This sustained spell of wet weather has been caused by relentless onshore winds interacting with a series of low pressure troughs and the relatively hilly terrain of the Central Coast region. The shape and orientation of the coastline also makes the Central Coast a bit more susceptible to rain than Sydney in southerly winds, which has been a frequent wind direction along the NSW coast in recent weeks. Image: Estimated accumulated rain over the past 7 days, showing heavier coastal rain to the north of Sydney, which is common in southerly winds. Some of the standout totals in the Central Coast region between 9am April 1 and 9am May 21, a period of 51 days, include: 710 mm at Norah Head, more than half its annual average of about 1170 mm 617 mm at Swansea, about half the annual average 550 mm* at Gosford, about double the April-May long-term average *Gosford is missing some rain observations in May and may have received about 30 mm more rain than stated in this article. In Gosford, only four of the first 21 days in May have been completely dry and the suburb is already having its wettest May in 20 years. Like many areas in eastern NSW, this prolonged run of wet weather has left the ground laden with water and caused the Central Coast Council to close sport grounds across the region on numerous occasions. Image: At least there were rainbows at some of the local sport fixtures that managed to go ahead this month. This one was seen from Killarney Vale on May 20. Source: Supplied Looking ahead, showers are likely to clear the Central Coast from Wednesday and while there is a chance of some wet weather on the weekend, it’s not looking heavy at this stage.
Weather in Business

14 May 2024, 3:01AM UTC
Can auroras affect aeroplanes?
Auroras lit up the skies on the weekend amid one of the strongest geomagnetic storms in years, but did this display impact aeroplanes and the aviation industry? The spectacular exhibit was the aurora borealis/australis, or northern and southern lights seen in both hemispheres. Images: Aurora Australis on Saturday, May 11 from Bendleby Ranges, SA (top), source: @bendlebyranges and Ricketts Point, Vic (bottom), source: @dayofthedreamer These lights are typically only seen in the polar latitudes, but this weekend they were spotted in the Southern Hemisphere as far north as Mackay in Queensland. This was caused by the strongest solar flare and storm seen in over 20 years. This auroral display was caused by a solar flare and multiple coronal mass ejections (CMEs) which erupted from the sun over a few days last week. Charged particles were then carried from the sun to earth by a solar wind. When these particles reached earth, they interacted with our planet’s magnetic field and were driven towards the magnetic poles. In the upper layer of the atmosphere called the ionosphere (90km above the surface) the solar wind collides with oxygen and nitrogen in this layer and produces a colorful display. The southern lights typically occur between 50 and 800km above the surface, well above the layer of atmosphere that planes typically fly in. So, do they impact aviation despite occurring well above the flight level? Yes, space weather events like this can impact aviation communications, navigation and surveillance systems. They can also increase the radiation exposure of aircraft in the air. Images: Aurora Australis from Virgin plane cockpit on Saturday, May 11. Source: @shelbytillett The charged particles caused by CMEs can modify the upper layer of earth's atmosphere called the ionosphere, which can impact our technology systems. High frequency radio communication depends on the ionosphere reflecting radio waves back down to earth. Satellite communication, navigation and surveillance rely on the transmission of signals through the ionosphere. According to the Bureau of Meteorology’s space weather department, >Space weather events that modify the density and/or structure of the ionosphere can therefore significantly impact the performance of HF COM, SATCOM and SATNAV systems". While communication and navigation can be impacted by the modification of the ionosphere, the electricity network can also be impacted. The storms can induce currents in power lines, overheating transformers, which can potentially cause power outages. The strongest geomagnetic storm ever recorded occurred during September 1859, called the Carrington Event. This event caused multiple fires of telegraph systems across Europe and North America. There have been no reports of negative major impacts of this solar storm, it was merely a spectacular display that captivated people across the world. Unfortunately, auroras are notoriously difficult to forecast as they need multiple factors to line up for these beautiful lights to occur. Looking ahead, the sun is nearing its solar maximum, which means we could see more sunspots on the sun's surface this year. This could increase our chance of seeing more spectacular displays in the coming months.
07 May 2024, 11:23PM UTC
How severe thunderstorms impact energy infrastructure
Earlier this year destructive thunderstorms and winds equivalent to a category two cyclone lashed Victoria, bending towers and toppling trees and poles. So, how can thunderstorms damage energy infrastructure, and are these events getting worse? This event occurred during mid-February 2024, when a strong cold front generated severe thunderstorms and localised wind gusts of 130km/h after a prolonged period of extreme heat. The image below shows a squall line around 1,500km long causing lightning across four states in February. Image: Himawari-9 satellite image, lightning and radar on Tuesday, February 13 at 3pm AEDT. The destructive winds were caused by microbursts, which bent towers and toppled trees and poles in Vic, leaving thousands without power. Image: Damaged transmission towers at Anakie, Source: AAP Microbursts are a localised column of sinking air (downdraft) within a thunderstorm and is usually less than 4km wide. The cold, heavy air within this downdraft descends rapidly to the surface and then spreads out in all directions as it hits the ground. The image below shows how wind gusts are produced in thunderstorms. Microbursts can be destructive and cause wind gusts above 100 km/h, which can be a risk for power infrastructure. The force applied to the structure is roughly proportional to the speed squared. Fierce wind gusts from thunderstorms can: Knock down trees, which can fall onto power lines Topple poles Knock out transmission towers. Microbursts typically occur during the warmer months of the year and, unfortunately, they can develop rapidly and last for only a short period of time, making them difficult to predict and warn communities about. Have these thunderstorm events become more severe in Victoria? The severe thunderstorm season across southern Australia occurs during the warmer months of the year, between November and April. While thunderstorms are more common across northern Australia, Qld, and NSW, they do occur frequently in the summer months. The map below shows the annual average lightning density in Vic between July 2014 and June 2023, with the most lightning occurring in the northeast high country each year. Image: Weatherzone’s Total Lightning Network Annual lightning density mean between July 2014 and June 2023. You can see in the map above that lightning is common to the north of Ballarat near Learmonth and Miners Rest, with the region seeing 37.7 pulses per year. The high country near Benalla and Whitfield recorded an average of 28.1 pulses, Thorpdale in Gippsland saw 24.5 pulses, and Melbourne only 8.2 pulses per year. Research has shown that the warming climate is increasing the risk of heatwaves and bushfires, which can impact energy infrastructure. Unfortunately, it is unknown how global warming will affect thunderstorms and their associated destructive winds. To research climate change's impact on thunderstorms, we would need quality data that dates back well into history. Unfortunately, detecting lightning is a fairly new phenomena, so a solid climate base to compare data to is not currently existent. According to the University of Melbourne researchers and Watt Clarity, ‘The evidence we do have suggests continued climate change may potentially increase the risk of extreme winds from thunderstorms. This is partly due to more moist and unstable air, which are essential for thunderstorms to form. We think these conditions could occur more often with climate change, in part because warmer air can hold more moisture.’ Indeed, much of Australia had an unusually stormy summer 2023/24, with Melbourne, Canberra and Brisbane all seeing 5 to 6 extra storm days a season. The map below shows that an unusually high number of thunder days were seen over most of Qld, NSW, SA, Vic, the ACT and Tas during the summer of 2023/24 compared to the average of the most recent nine years. Image: Thunder day anomalies for summer 2023-24 versus the average thunder days for the nation’s nine most recent summers (2014/15 to 2022/23).