
We have never seen El Niño strengthen this quickly – so what happens next?
The developing 2026-27 El Niño is strengthening faster than any major El Niño event since 1900, placing it in rare territory among the most powerful early-stage El Niño events of the past 126 years.
The relative Niño3.4 index – a measure of sea surface temperature anomalies in the central tropical Pacific Ocean – reached +1.84°C in August. This was the third consecutive month above the Bureau of Meteorology’s El Niño threshold of 0.8°C, and the highest monthly value since 2016.
The relative Niño3.4 index adjusts for long-term warming trends, providing a cleaner comparison across different decades
While this latest value is still a fair way below the strongest El Niño on record from 1902, which had a peak relative Niño3.4 value of +2.65°C, the rate at which this event has strengthened since the start of the year is unrivalled in records dating back to 1900.
La Niña to El Niño in the blink of an eye
The Pacific Ocean was in a La Niña phase at the beginning of 2026, with cooler-than-average water at the surface of the central tropical Pacific. This La Niña event broke down from February and was officially declared over in March. Since then, the Pacific has rapidly transitioned to El Niño at a blistering pace.
The monthly relative Niño3.4 index rose from -0.92°C in January to +1.84°C in August, an increase of 2.76°C in just seven months. This is the fastest January-to-August rise on record for the relative Niño3.4 index, beating the previous record of 2.17°C in 1997.
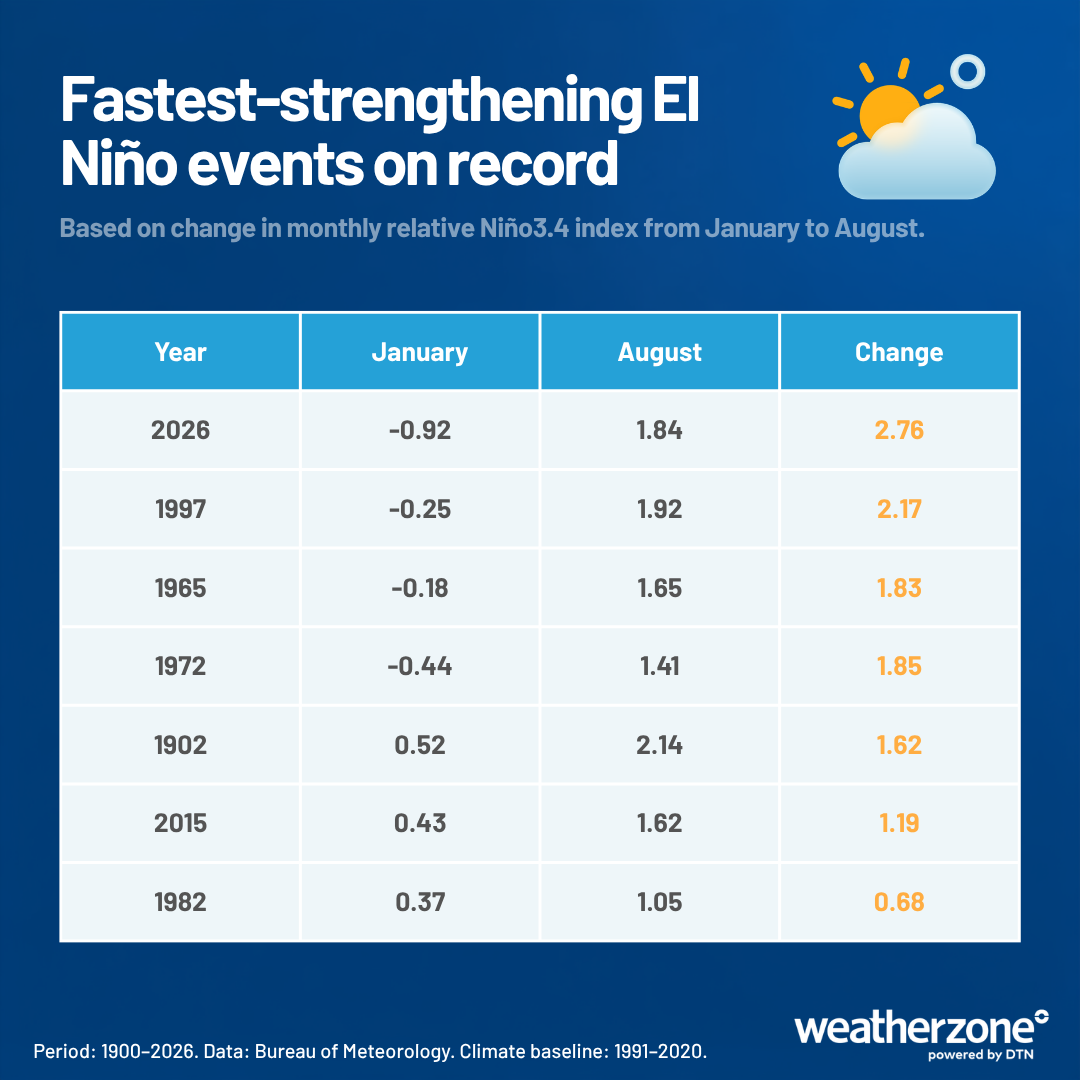
Image: Top seven fastest-strengthening El Niño events on record, based on the increase of the relative Niño3.4 index between January and August in the same year. Source: Weatherzone.
El Niño already in rare territory, but peak still months away
El Niño events typically start between April and September, peaks between November and January and ends between February and June. Broadly speaking, this means El Niño follows an autumn-to-autumn evolution cycle, with a peak around summer in the Southern Hemisphere.
August is still in the development phase of the typical El Niño lifecycle, which makes it remarkable how strong the 2026-27 has already become. Last month’s relative Niño3.4 index value of +1.84°C was the 4th highest August value in 126 years of records, beaten only by 1905 (+1.87°C), 1997 (+1.9°C) and 1902 (+2.14°C).
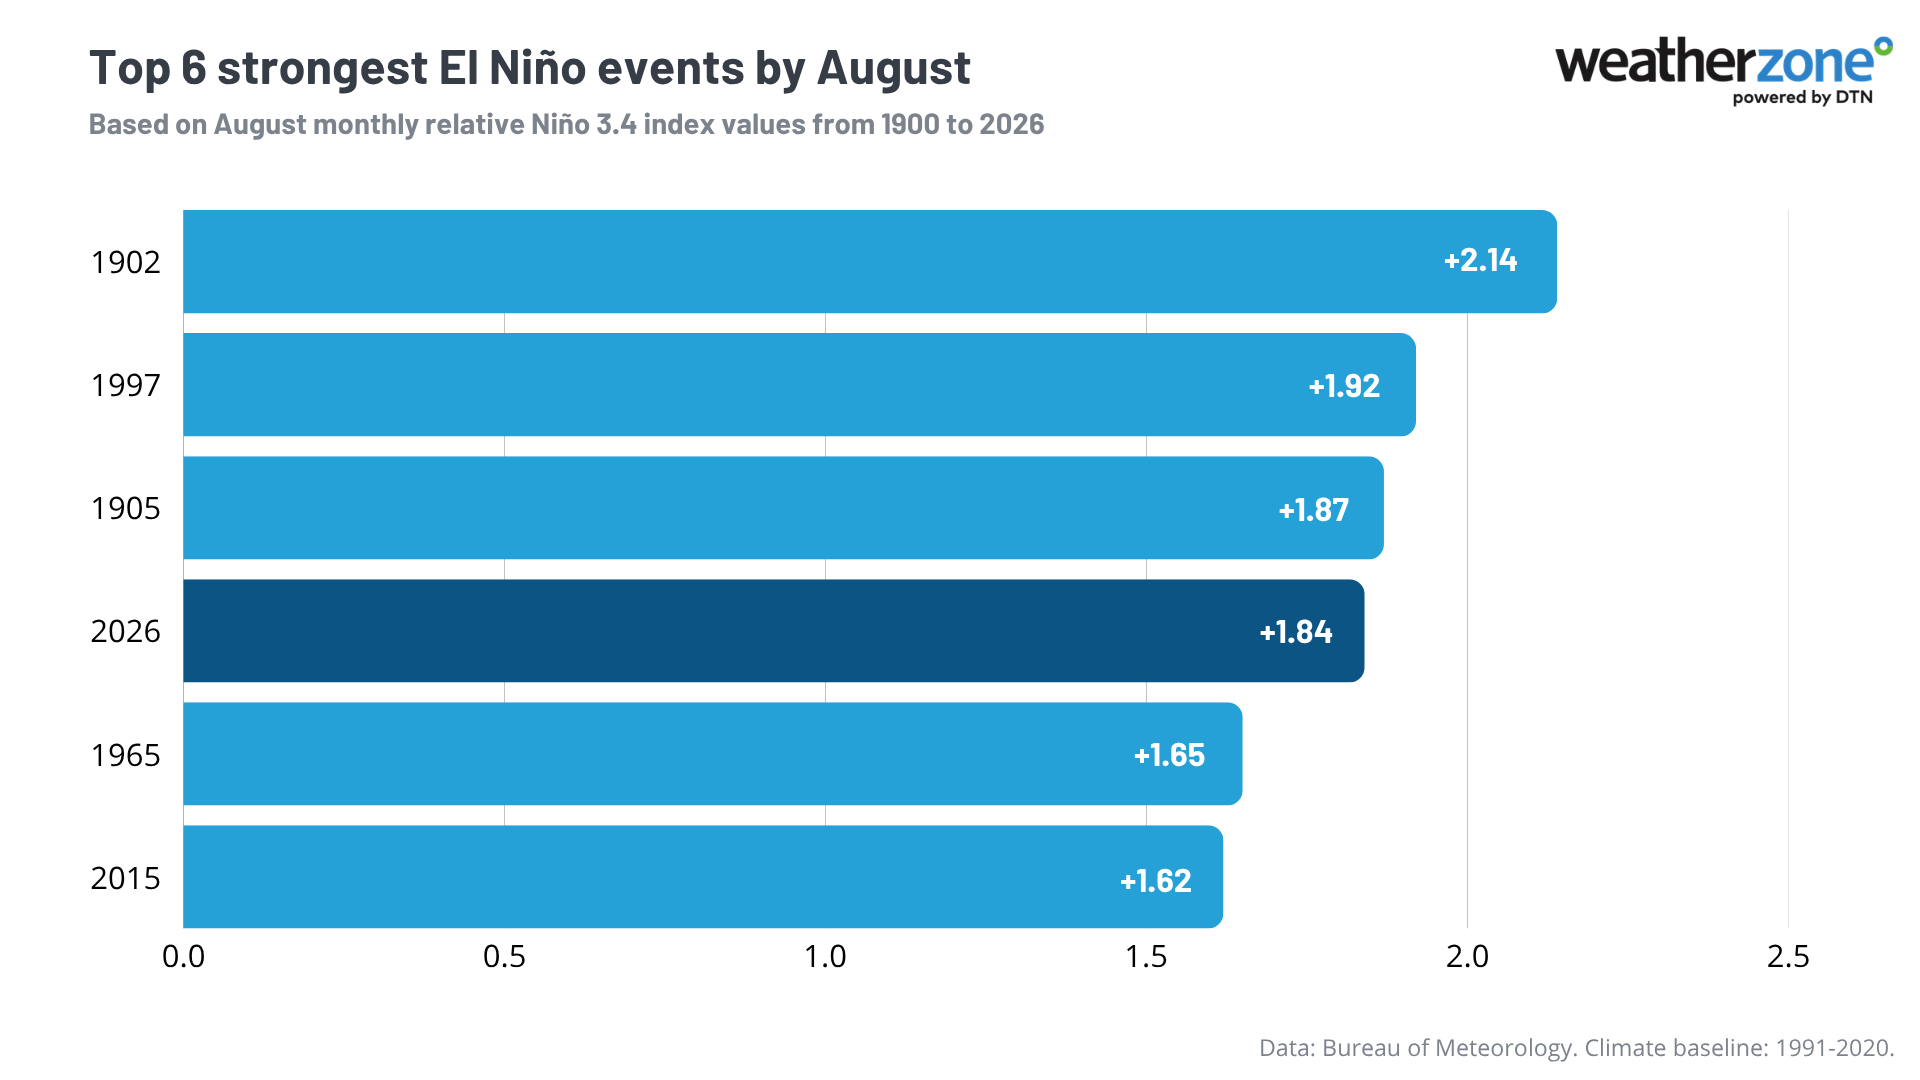
Image: Top six strongest El Niño events by August, based on data from 1900 to 2026. Source: Weatherzone.
How strong will the 2026-27 El Niño get?
It is important to point out that the pace at which El Niño has strengthened since the start of this year does not determine how it will continue to develop in the coming months.
When looking at what to expect in the months ahead, there are two things that can be helpful: past analogues and computer model forecasts.
Based on past El Niño events, the 2026-27 El Niño is likely still around 3–4 months away from its peak.
The graph below shows the development of the 2026-27 El Niño compared to some of the other strongest El Niño events ever observed.
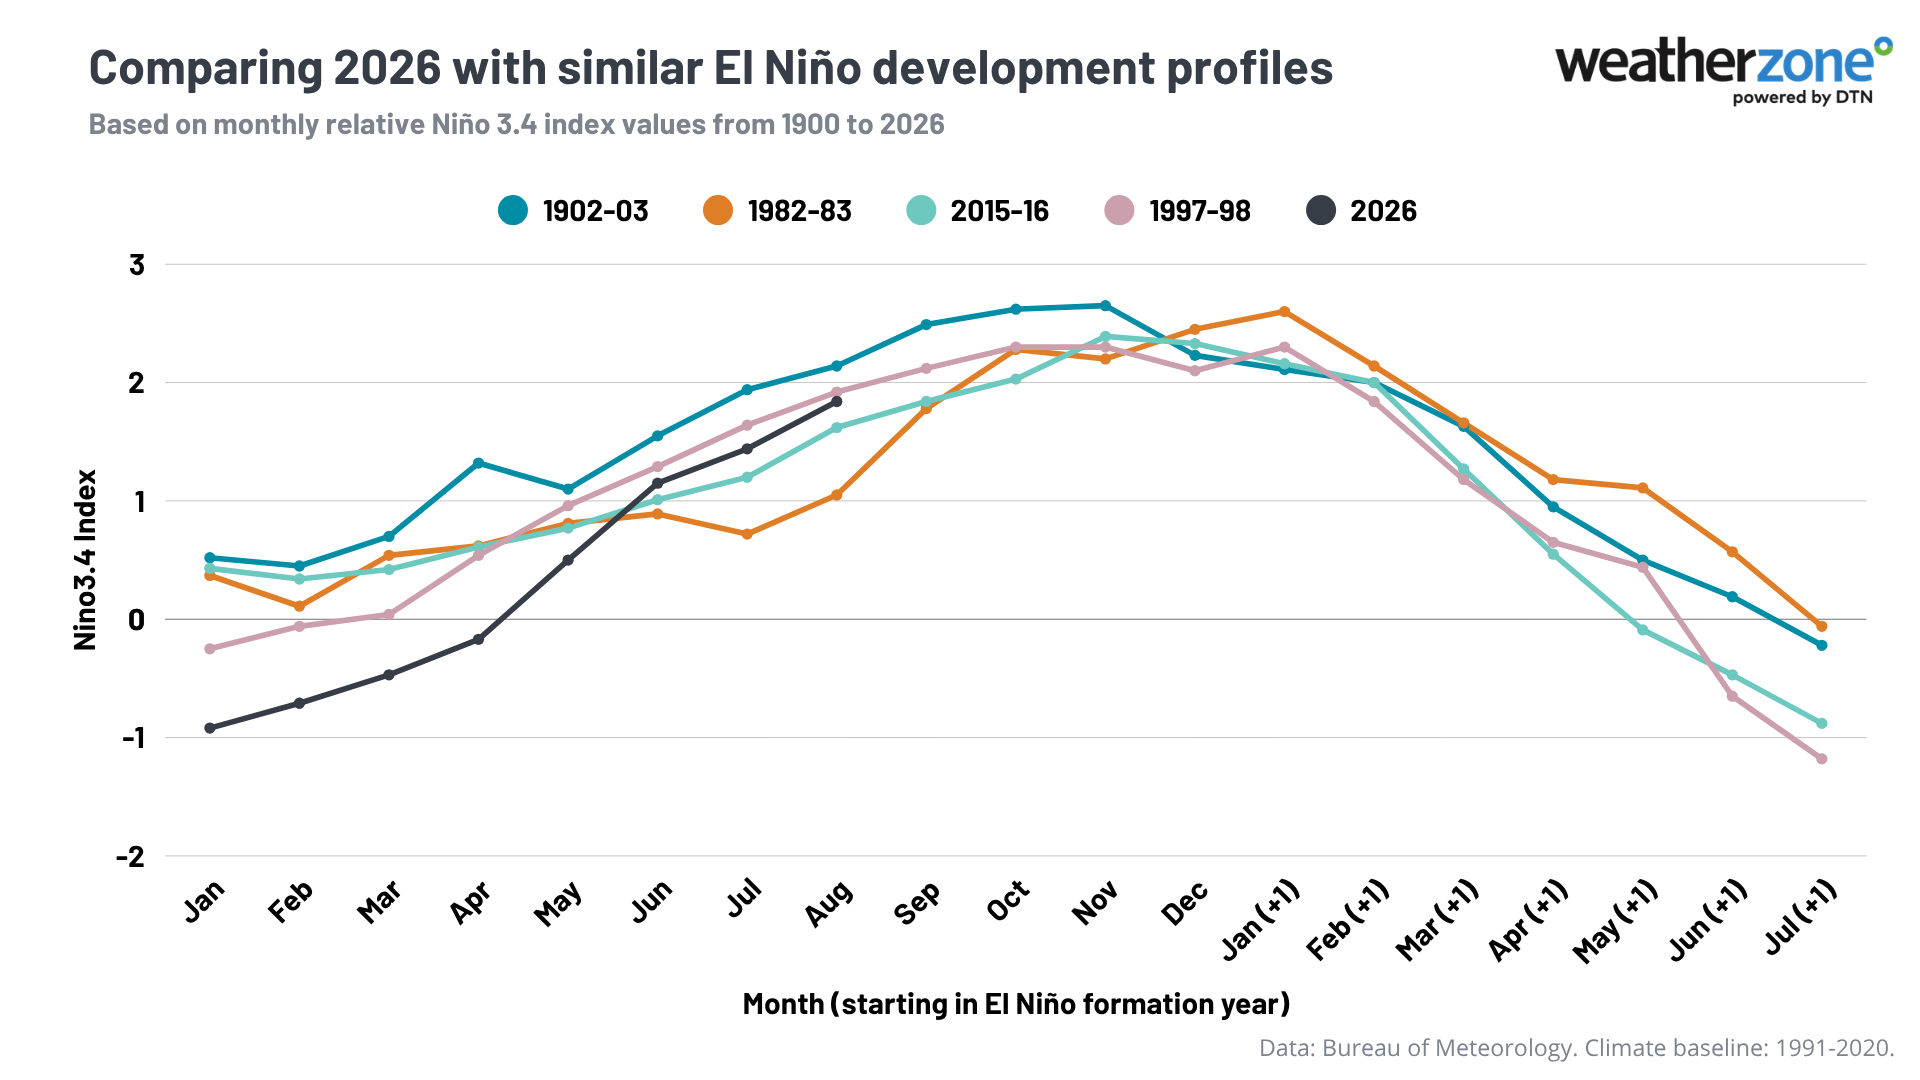
Image: Monthly relative Niño3.4 index evolution of the 2026-27 event compared with some of the strongest El Niño events on record. Source: Weatherzone.
The 2026-27 El Niño is strengthening at a rate that is close to or exceeding all other major El Niño events of the past 126 years. Its development profile so far this year is comparable to a 1997-class or 1902-class event, which both strengthened by another 0.4–0.5°C after August. The largest August-to-peak increase on record was the 1982-83 event, which had a relative Niño3.4 value of +1.05°C in August before peaking at +2.60°C in January – an increase of 1.55°C.
Based on these historical analogues, it is plausible that the 2026-27 El Niño could strengthen by another 0.5–1.5°C in the coming months, which equates to a relative Niño3.4 value of around +2.34°C to +3.34°C.
Computer models support this outlook. While there is some uncertainty regarding exactly how much El Niño will strengthen, there is good model agreement that the peak will be above +2.0°C and may exceed +3.0°C on the relative Niño3.4 index. A monthly Niño3.4 value higher than +2.65°C would make this the strongest El Niño on record.
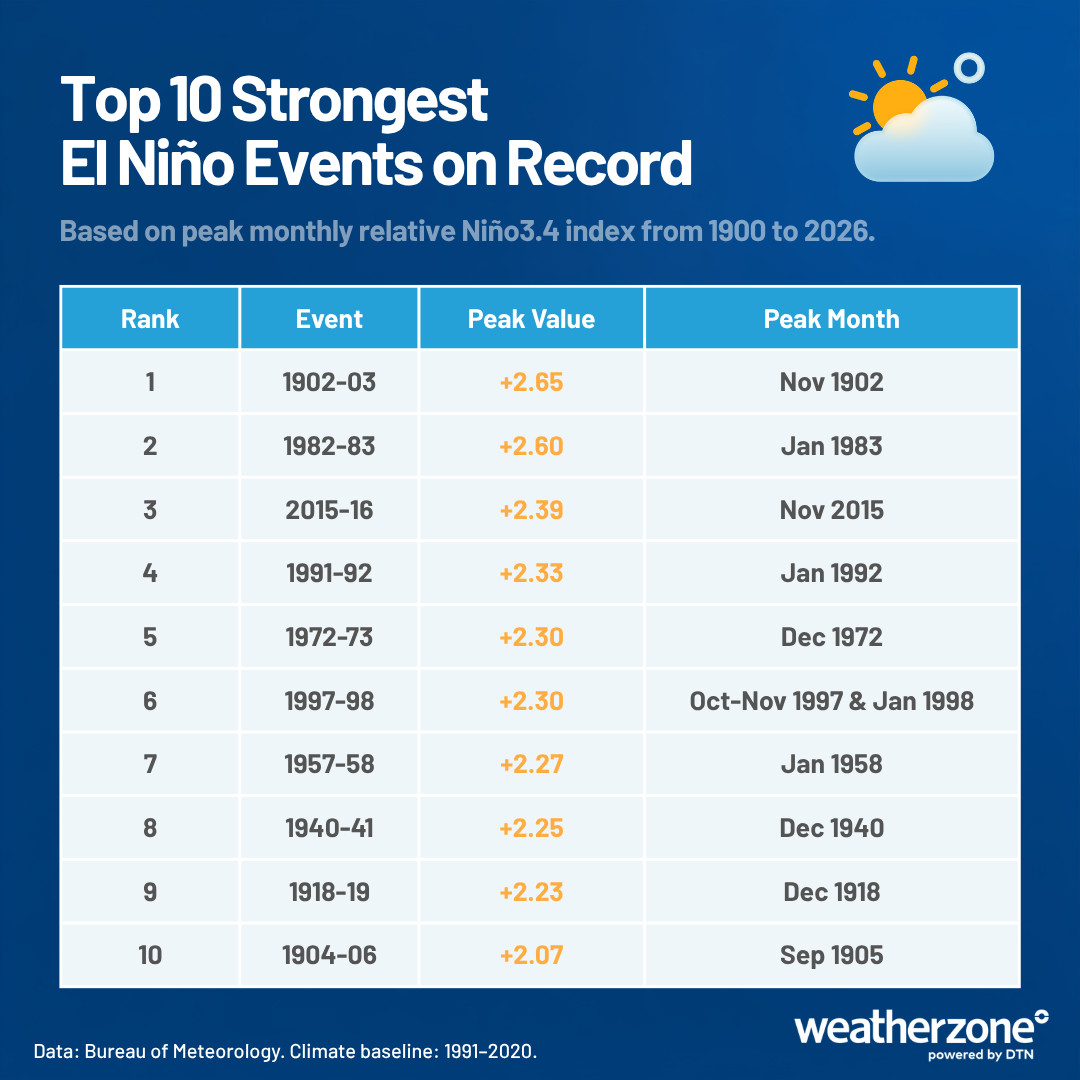
Image: Top 10 strongest El Niño events on record based on peak monthly relative Niño3.4 index from 1900 to 2026. Source: Weatherzone.
How will the 2026-27 El Niño affect the weather?
El Niño typically affects weather patterns across the planet, making some areas warmer and drier and others wetter and colder.
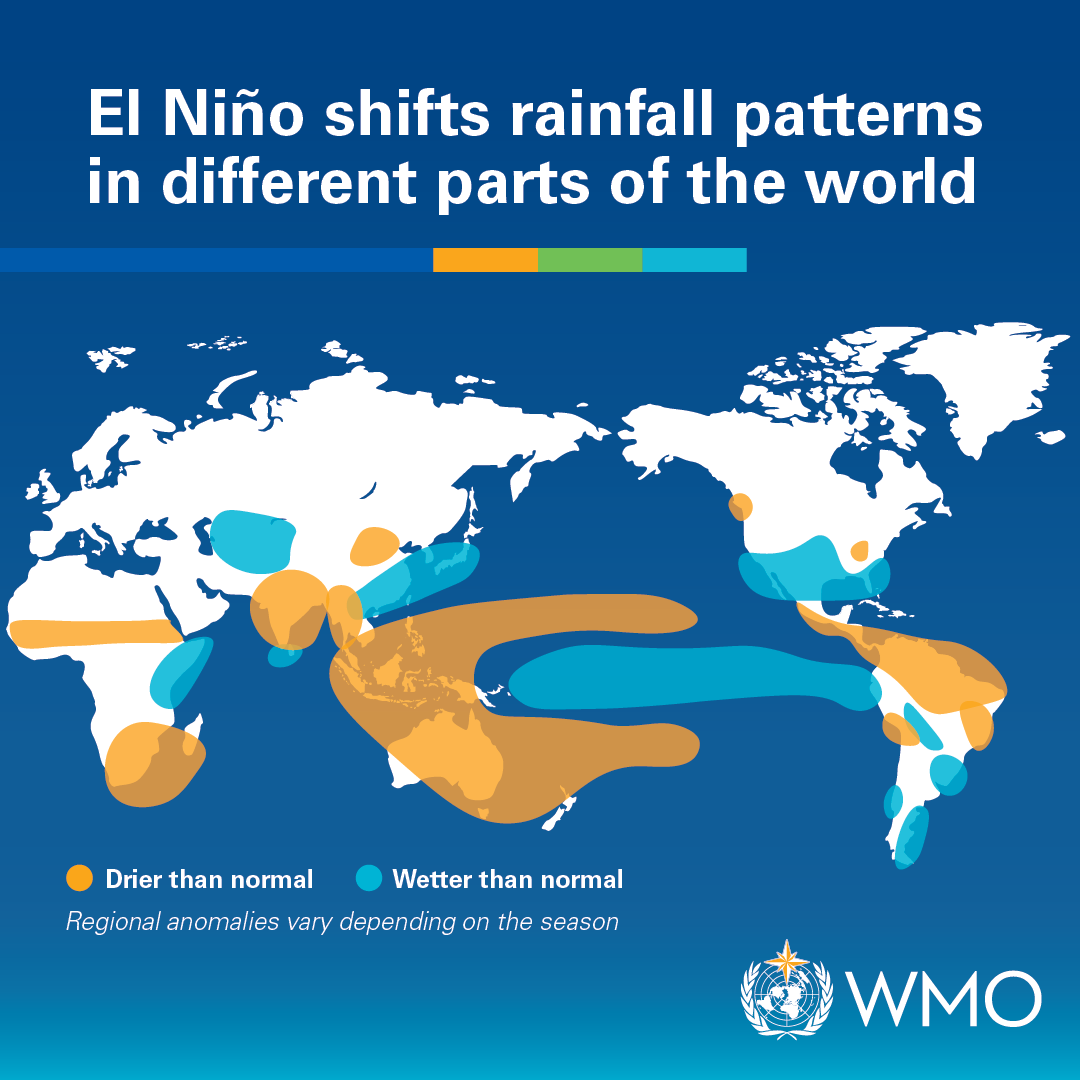
Image: Typical changes to global rainfall patterns under the influence of El Niño. Source: World Meteorological Organization (WMO).
With El Niño currently gaining strength at a rapid pace, parts of the world are already feeling its influence.
Parts of Indonesia are being affected by drought following low rainfall from June to September this year. This abnormally dry weather, which is associated with the developing El Niño, has also enhanced early-season fire activity in parts of Indonesia. Previous strong El Niño years – 1997 and 2015 – have also been associated with bad fire seasons in Indonesia.
At the beginning of September, NASA’s Aqua satellite captured images of widespread smoke across Borneo as more than 900 fires burned across the region. Indonesia and surrounding parts of the Maritime Continent typically experience below-average rainfall during El Niño, which enhances the risk of peat fires.
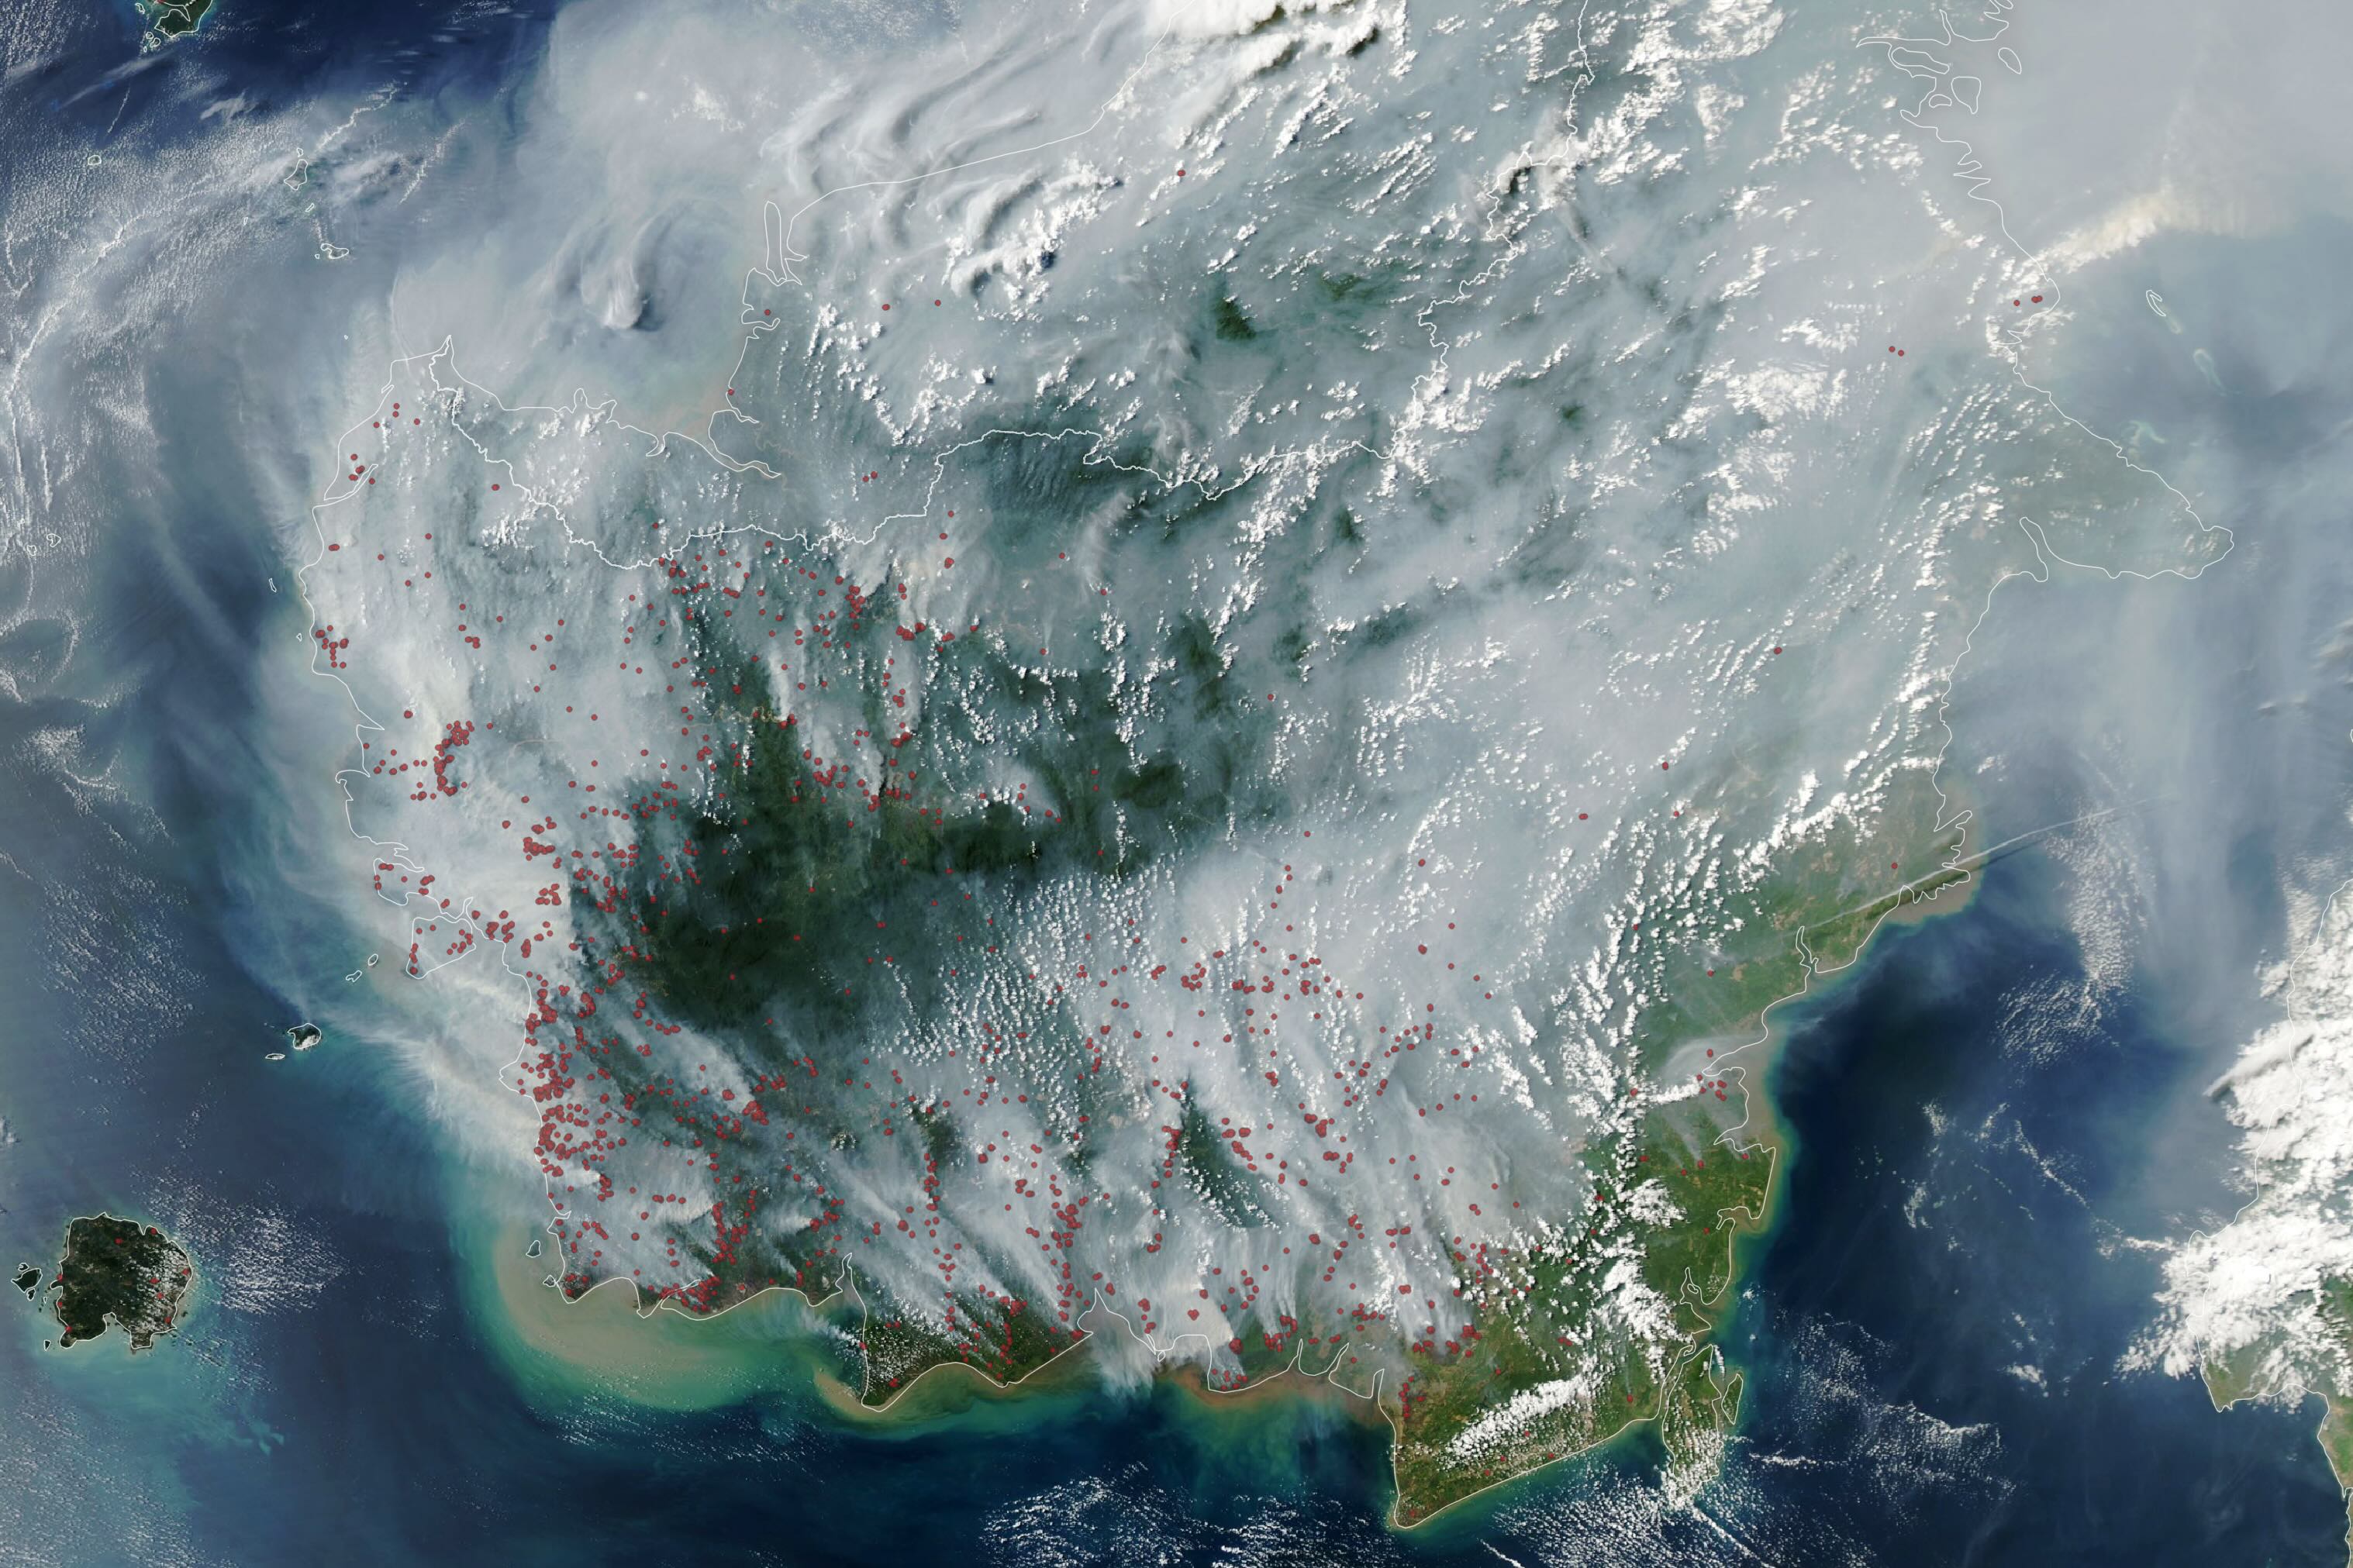
Image: Smoke and fire hotspots (red dots) over Borneo on September 1, 2026. Source: NASA / Aqua.
In Australia, typical impacts of El Niño include:
- Below-average rainfall over large areas of Australia during winter and spring. However, its influence on rainfall is typically weaker in summer and autumn.
- Above average maximum temperatures for most areas outside the tropics, particularly during the second half of the year.
- More intense daily heat extremes in southern Australia, but with a reduced frequency of prolonged heatwaves.
- An increased risk of dangerous fire days in southeastern Australia as temperatures rise in spring and summer.
- Decreased seasonal peak alpine snow depths and a shorter snow season.
It’s also worth looking at how Australia’s weather has been impacted by some of the strongest El Niño events in the past.
1997–98 El Niño
The closest analogue to the developing 2026-27 El Niño, based on the evolution of the relative Niño3.4 index during the event, was the 1997-98 El Niño.
The impact of this El Niño event was mixed across Australia. The 12 months from April 1997 to March 1998 saw parts of Queensland, New South Wales, Victoria and Tasmania registering rainfall totals in the lowest 10% of historical records for this period. However, there were periods of decent rain in some parts of the country, so the overall impact of this El Niño was relatively weak.
Temperatures were above average for most of Australia during spring and summer under the influence of this El Niño. At the time, this was Australia’s warmest summer on record.
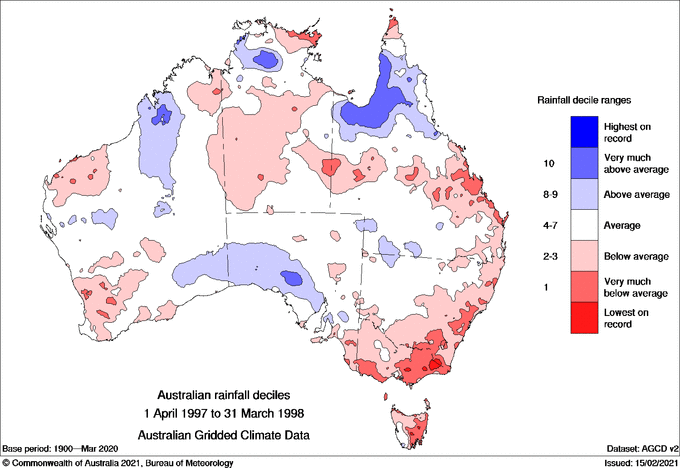
Image: Rainfall deciles during the 12-month period from April 1997 to March 1998. Source: Bureau of Meteorology.
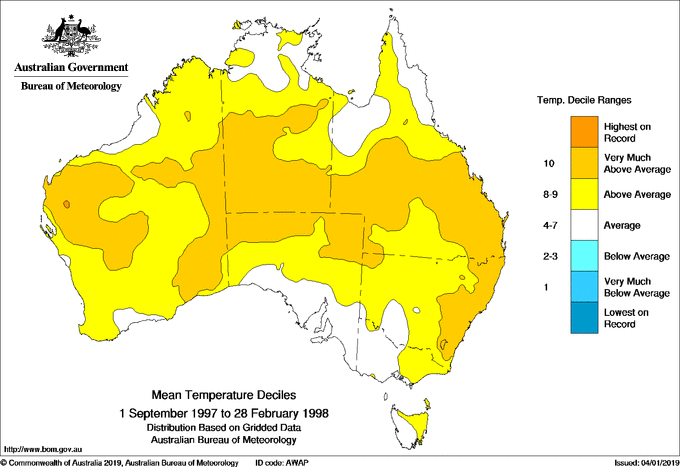
Image: Mean temperature deciles between September 1997 and February 1998. Source: Bureau of Meteorology.
2015–16 El Niño
This was the most recent very strong El Niño event and it had a moderate effect in Australia’s weather.
One of the standout periods during this El Niño was September and October 2015, which saw widespread below-average rain across large areas of Australia, including Australia’s 4th driest September on record. Large areas of eastern and northern Australia also had below-average rain in the first four months of 2016. It’s important to point out that this dry period was enhanced by a positive Indian Ocean Dipole (IOD) as well as El Niño.
Temperatures were also well above average during this El Niño event, particularly in southern Australia, where the mean temperature in spring 2015 set a record that still stands today.
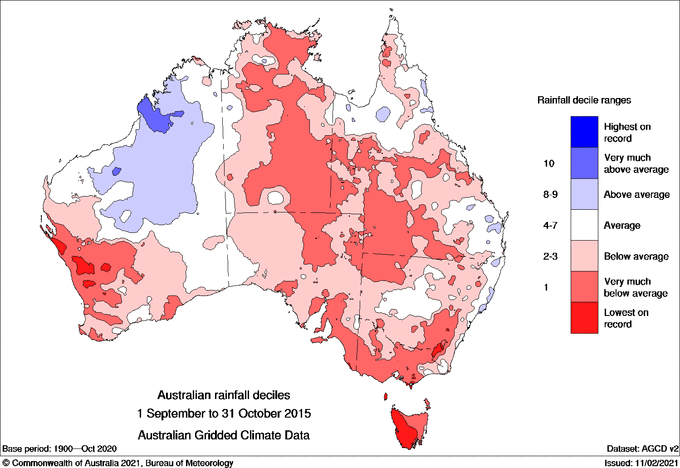
Image: Observed rainfall deciles in September–October 2015. Source: Bureau of Meteorology.
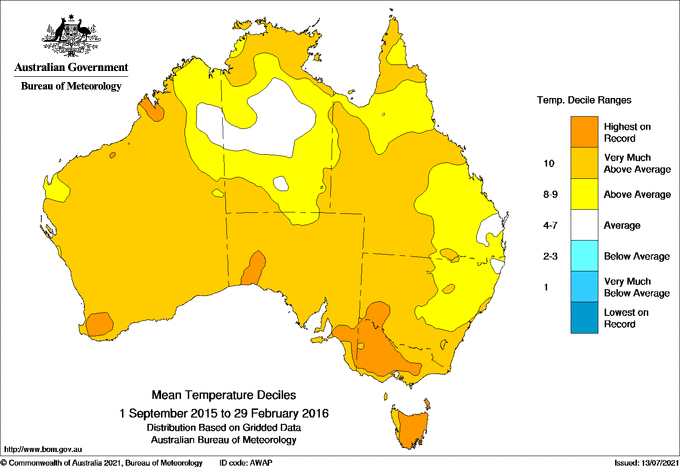
Image: Mean temperature deciles between September 2015 and February 2016. Source: Bureau of Meteorology.
1982–83 El Niño
This was one of the most famous El Niño events on record for Australia, causing widespread drought across eastern and southern Australia. This dry weather was also associated with unusually high temperatures, which exacerbated the drought and led to the Ash Wednesday bushfires.
According to the Australian Institute for Disaster Resilience, more than 86 million sheep and 14 million cattle died as a result of this drought.
The 11 months from April 1982 to February 1983 were the driest such period on record for large areas of Victoria, NSW, SA, Queensland, the NT, Tasmania and the ACT.
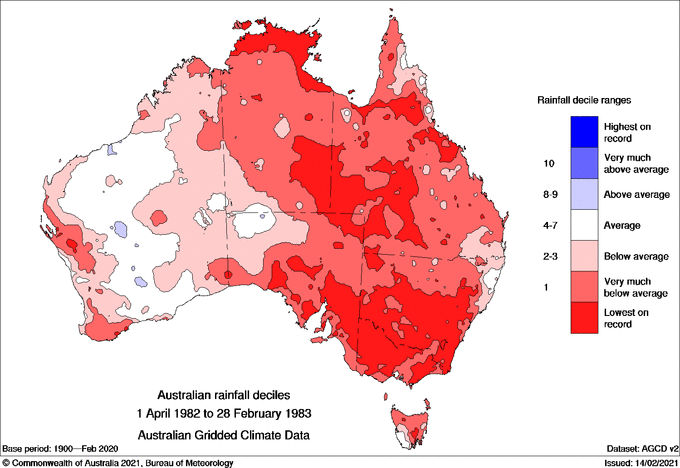
Image: Observed rainfall deciles from April 1982 to February 1983. The darkest red shading shows where rainfall was lowest on record for this 11-month period. Source: Bureau of Meteorology.
El Niño does not act alone
It is important to note that El Niño does not act alone and other influences, such as the IOD, the Southern Annular Mode (SAM) and sea surface temperatures near the Australian continent can all affect how El Niño impacts Australia’s weather. In some cases, these other influences can enhance the impact of El Niño in Australia, and in other cases, they can counteract it.
Computer models suggest that a weakly positive IOD may develop this spring. If this happens, it will support the drying influence of El Niño for Australia.
However, sea surface temperatures closer to western, southern and southeastern Australia are expected to be above average this spring and summer. These warm waters could produce extra moisture through enhanced evaporation, which could boost rain and thunderstorm activity in some areas.
Seasonal outlooks currently show mixed signals for rainfall this spring, with the Bureau of Meteorology predicting above average rain in the west and drier than normal conditions in the east, southeast and far southwest of Australia.
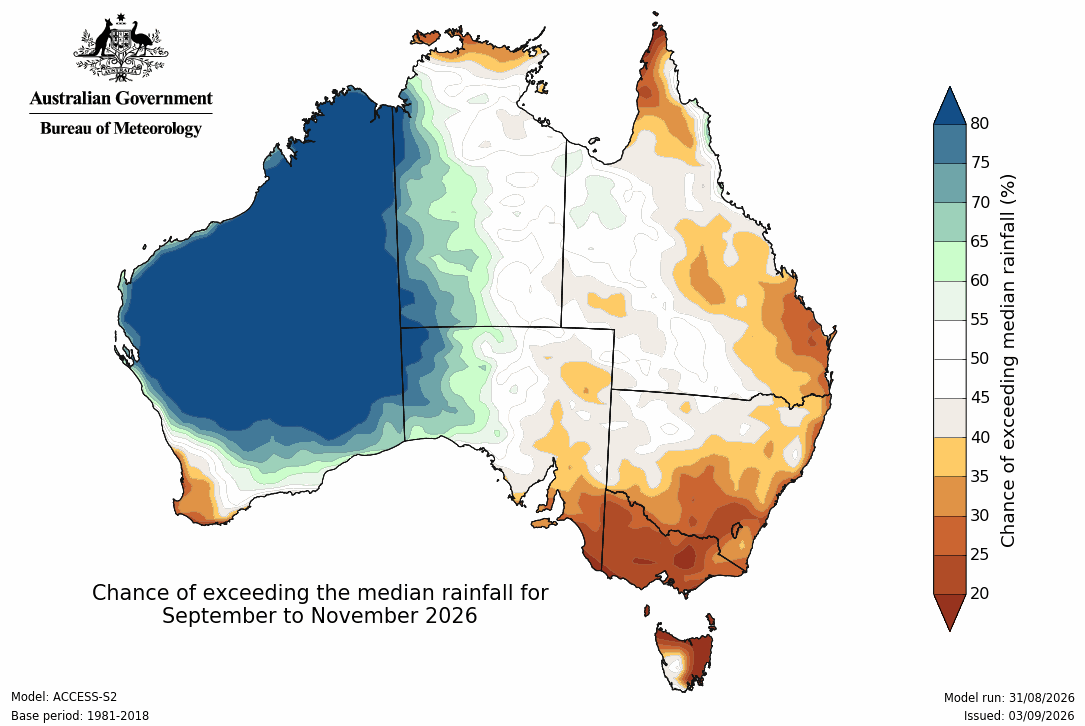
Image: Rainfall outlook for spring 2026. Source: Bureau of Meteorology.
Forecasts are clearer for temperature, with most of Australia expected to be warmer than average this season.
The combination of unusually warm and dry weather in some parts of the country also increases the risk of fires. The spring seasonal bushfire outlook from AFAC highlights an increased fire risk in parts of seven Australian states and territories this spring.
Meteorologists will be closely monitoring El Niño and other climate drivers to see how they will influence weather in Australia and other parts of the world in the coming months.