
Three numbers you need to know from this week's IPCC report
The Intergovernmental Panel on Climate Change (IPCC) released a monumental report about our planet's climate this week.
Titled 'Climate Change 2021: The Physical Science Basis', this mammoth 3,000+ page report distills the latest research and data on how our climate is changing, what's causing it and what might happen in the future.
In a report this big, there are a lot of numbers. We mean A LOT. The numerical digit 1 features 294,988 times throughout the report. And while every one of these numbers are important, there are a few key figures that everyone in Australia should know about.
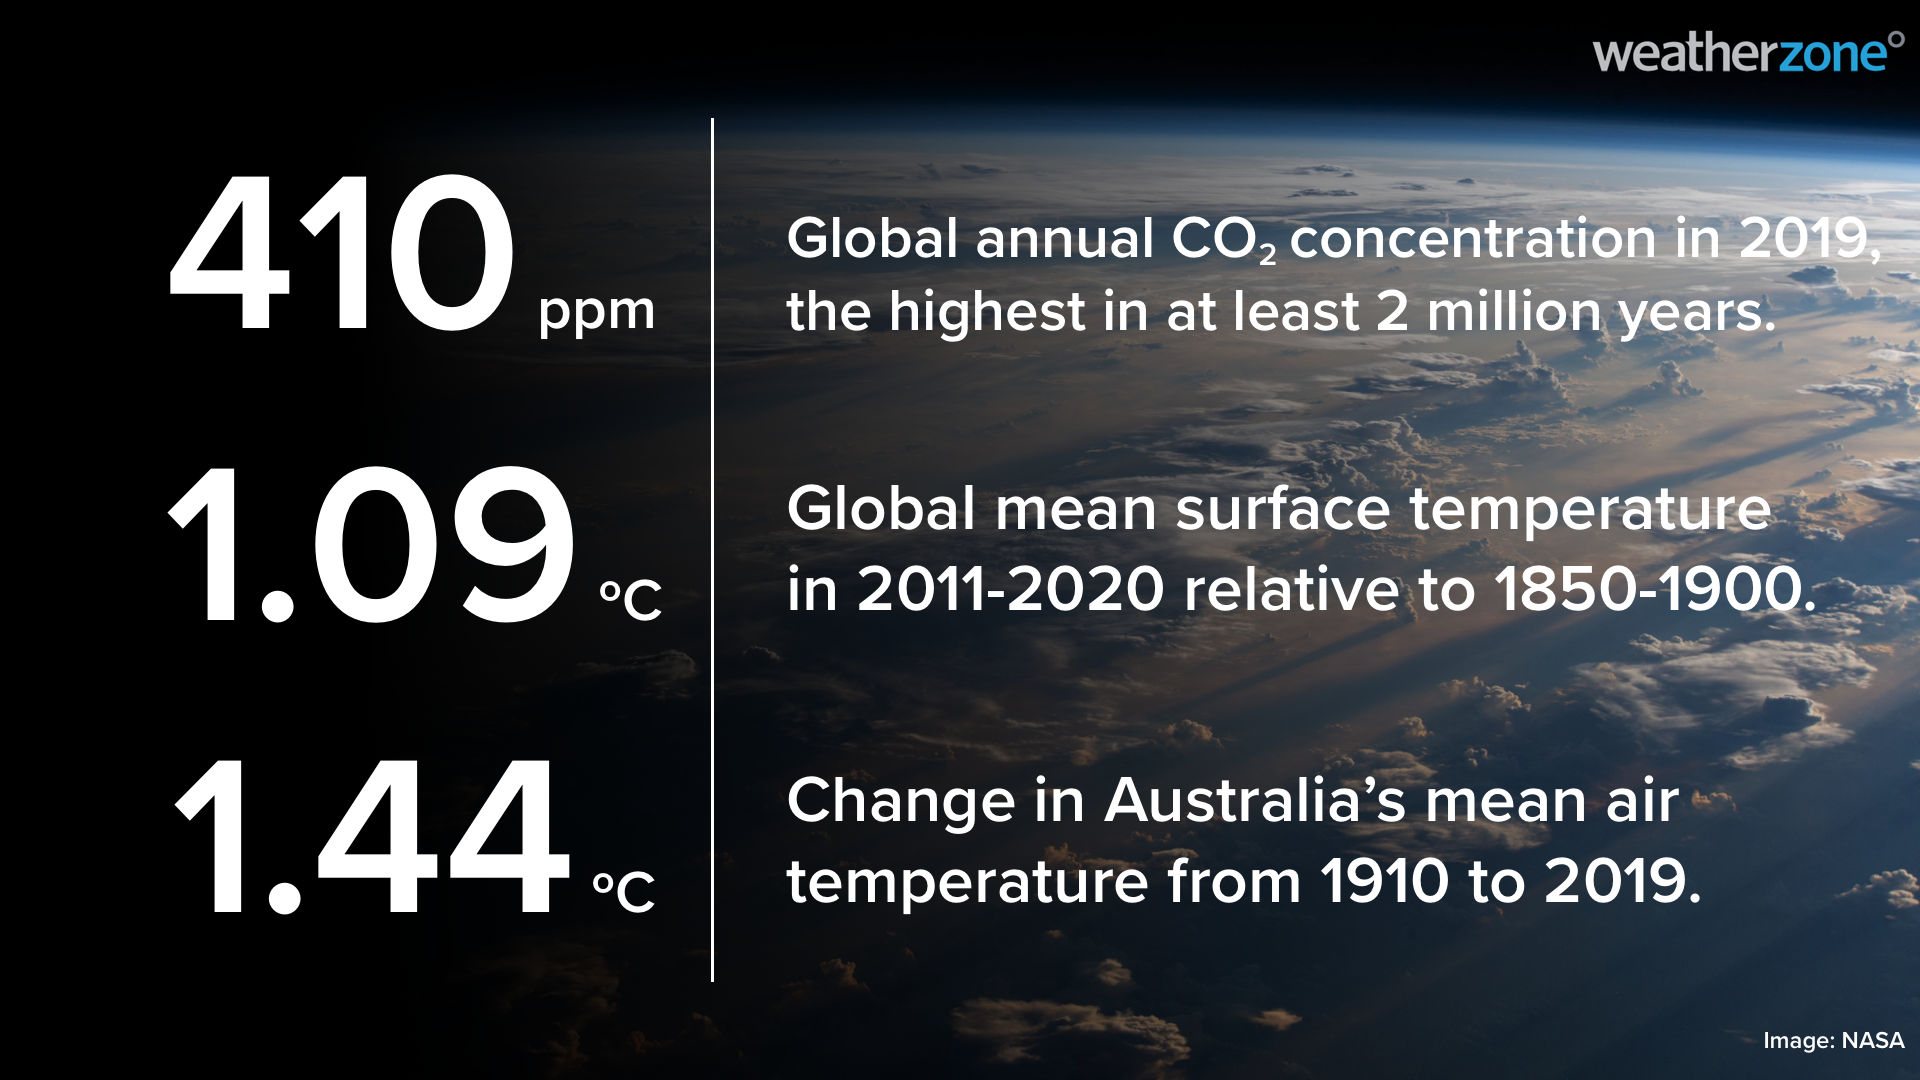
> 410 ppm <
The concentration of carbon dioxide (CO2) in our atmosphere reached an average level of 410 ppm in 2019. This is higher than any other point in the last 2,000,000 years and is 'unequivocally caused by human activities', the IPCC says.
The concentration of CO2 and other greenhouse gases are important because they cause changes to our Earth system. These changes include rising surface air temperature, sea level rise, increases in climate and weather extremes and changes to ocean acidification.
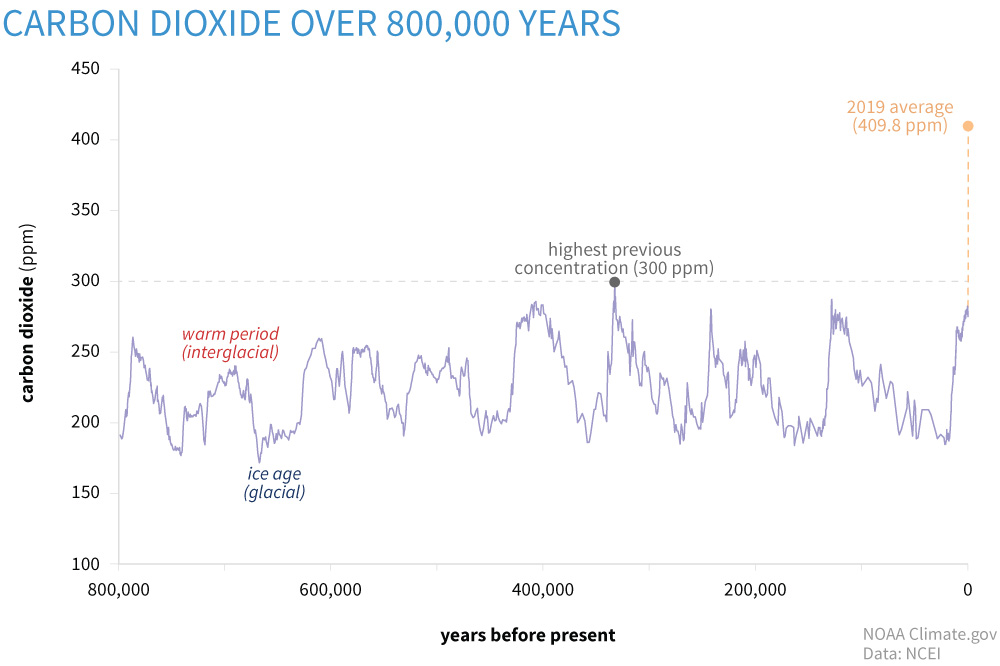
Image: Global average annual atmospheric carbon dioxide (CO2) concentration in parts per million (ppm) over the last 800 years. Source: NOAA / Climate.gov
> 1.09 ºC <
The global surface temperature in the decade ending in 2020 was 1.09 ºC warmer than it was during the 1850-1900 baseline period. This global warming has been unevenly distributed between land and oceans, with land areas warming by about 1.59 ºC and oceans warming by 0.88 ºC.
Of this 1.09 ºC global warming, around 1.07ºC is likely to have been caused by humans. Each of the last four decades were warmer than any decade that came before it since 1850.
> 1.44 ºC <
Australia's mean air temperature increased by 1.44 ºC during the period 1910 to 2019. Most of this warming occurred after 1950 and even more warming is anticipated as we progress through the 21st century.
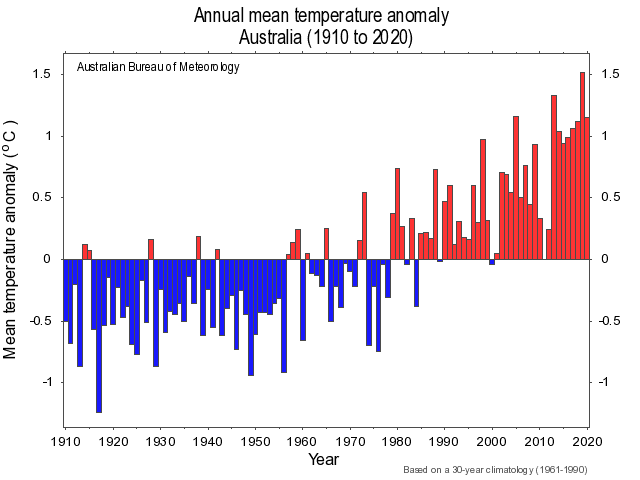
Image: Australia's annual mean temperature anomalies between 1910 and 2020, relative to the 1961-1990 baseline. Source: Bureau of Meteorology
The frequency and severity of extreme heat has also been on the rise in Australia since 1950 and will likely become more frequent in the coming decades. Climate change is also causing cool-season rainfall to decline in southwestern and southeastern Australia, while also increasing the length and severity of the bushfire season in southern and southeastern parts of the country.
Weatherzone will be publishing more in-depth stories about the IPCC report and climate change in Australia throughout this week. Check the news feeds on our app and website as the week unfolds.