
The weather eye in the sky
Satellites play an important role in meteorology and in our understanding of the atmosphere.
It all started back in April 1960 when NASA (National Aeronautics and Space Administration) launched what became the first weather satellite, Tiros-1. This satellite televised the first images of the earth and its atmospheric weather patterns.
Tiros-1 was used to test the concept of capturing imagery of weather systems and was operational for 2.5 months before an electrical failure incapacitated its ability to communicate. The satellite to this day (late 2024) remains in orbit.
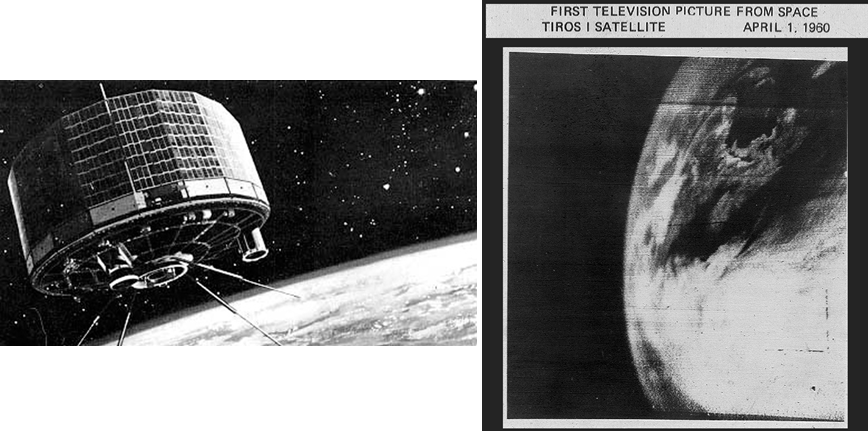
Image: An artist's impression of Tiros-1 (left) and the first image from space of the earth and cloud coverage (right) taken on 1st April 1960. Credit: NASA
Moving forward from the early 1960's, the advancement in sensor technology used to analyse the atmosphere has driven a greater understanding of meteorology and the interactions between the earth's surface and the atmosphere above.
In addition to capturing images of weather systems and cloud features, specifically designed sensors on these orbiting platforms also collect other surface and atmospheric features.
A very small sample of specific features include:
Sea surface temperature
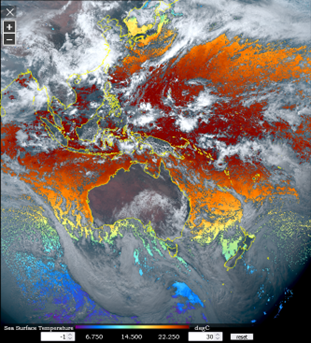
Image: Cloud overlaying sea surface temperature (SST) – temperature scale range is from –1C (violet) to 30C (crimson) Credit: JAXA Himawari Monitor (Japan Meteorology Agency)
Bushfires & Smoke
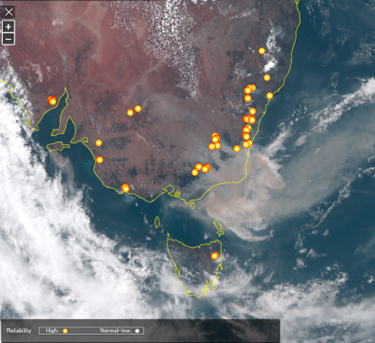
Image: Fire hotspots (yellow dots) and smoke (light brown) from the Australian Bushfires on 3 Jan 2020. Credit: JAXA Himawari Monitor (Japan Meteorology Agency)
Volcanic Eruptions & Ash cloud
Image: Lava hotspot (inside the red circle) and volcanic ash cloud during the eruption of Mt Sinabung (Sumatra, Indonesia) in March 2021. Source: NASA.
The various sensors on the current generation of weather satellites have an important role in generating and improving numerical weather forecasts. They can observe the temperature, humidity and wind flow through the full depth of the atmosphere across the entirety of the globe. And the importance of this cannot be understated over data sparse ocean regions in both the North and South Hemispheres. Without this added data source, the accuracy of today's weather forecasts would be severely hindered.
Governments and weather agencies around the world have put in place a network of weather satellites providing coverage across the entire globe. This multi-nation arrangement allows the transfer of satellite data to the multitude of meteorological and research agencies around the world.
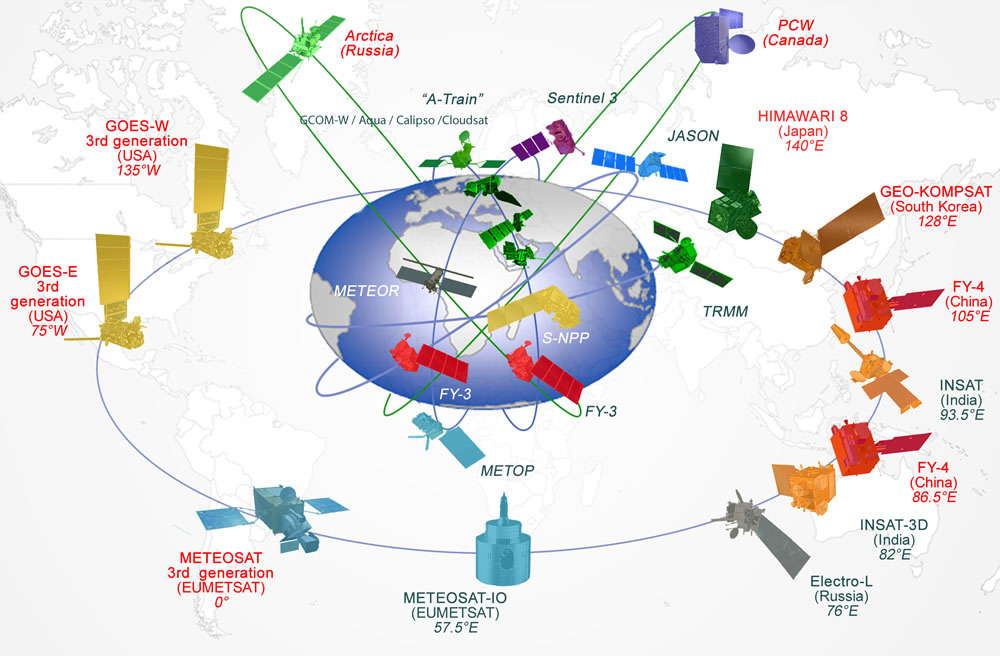
Image: Illustration of the network of weather satellites in orbit in the period 2015-2020 Source: DWD (The Deutscher Wetterdienst)
Covering the western Pacific Ocean region, including Australia, is the Japanese Meteorology Agency's Himawari 9 satellite. Located in a geostationary orbit on the equator at approximately 140°E, the Himawari 9 satellite has the following viewing footprint.
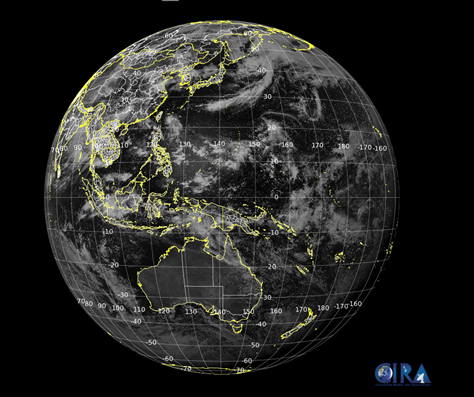
Image: Himawari-9 Visible satellite image of the globe Source: CIRA/RAMMB (Colorado State University)
Like the other geostationary satellites, Himawari is placed in an orbit which has the same period as an earth day giving it a stationary fix on the equator.
An interesting fact: The satellite is also positioned at an approximate altitude of 35,800 km or 1/10th the distance between the earth and the moon.
Weatherzone's “Australia Satellite” page provides access to Himawari real time satellite imagery.
There are five available satellite viewing options:
Visible – captures sunlight reflected off the Earth's surface and cloud. This imagery is limited to daytime only.
Infrared – detects thermal radiation emitted by the earth surface (land/ocean) and clouds. This imagery displays cloud structure during both day and night.
Day/Night - incorporates a composite of true-colour visible and infrared imagery for use during both day and night. This layer incorporates a variety of satellite wavelengths together to provide an 'all-in-one' display.
Enhanced Infrared – a more advanced form of infrared imagery. The thermal properties (or temperature) of the bodies in the image are represented by a temperature scale. Oceans are warm (dark blue) to colder clouds (yellow to brown).
Water Vapour – this imagery detects the amount of moisture in the atmosphere primarily between 5km and 10km in elevation.
This article highlights just the tip of the capabilities of the current generation of weather satellites. One thing is for sure, satellite imagery has an important place in meteorology and forecast generation.