
Records fall as El Niño strengthens
Records are being broken in the ocean and atmosphere as El Niño continues to strengthen in the tropical Pacific Ocean.
The Bureau of Meteorology officially declared that El Niño was underway in mid-June 2026, with modelling at the time indicating this could become one of the strongest events on record. This outlook appears to be materialising, with two records being broken last month.
Heat building beneath the surface
El Niño is associated unusually warm water in the central and eastern tropical Pacific and a shift in rain-bearing rising air away from Australia and toward the middle of the Pacific Ocean.
The chart below is a cross-section of the equatorial Pacific Ocean, showing sub-surface waters more than 5°C (up to about 9°C in some areas) warmer than average in the central and eastern Pacific.
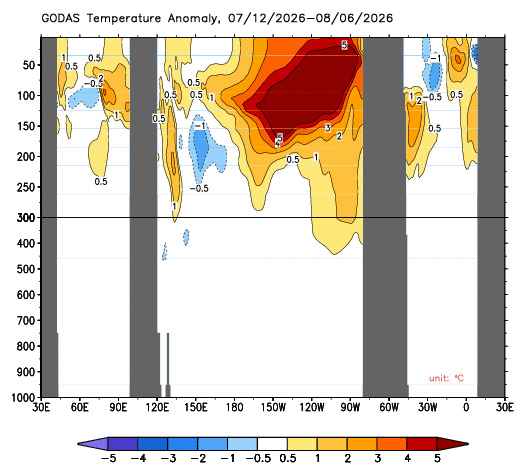
Image: GODAS subsurface temperature anomaly for the month leading up to August 08, 2026. Source: Bureau of Meteorology
According to the Bureau of Meteorology, the amount of heat sitting in this subsurface pool during July 2026 was the highest of any month on record since 1979. This record subsurface heat will provide fuel for this El Niño event to strengthen further, with weakening trade winds bringing the warm water to the surface and sustaining the event in the weeks and months ahead.
Record negative pressure difference between Darwin and Tahiti
It's not just the ocean that broke records in July – the atmosphere over the Pacific Ocean is showing an equally strong El Niño signal.
The rising air over the central eastern Pacific during an El Nino typically causes low pressure anomalies in that region while sinking air over the western Pacific causes high pressure anomalies around northern Australia. That pressure imbalance is measured an index called the Southern Oscillation Index (SOI), which goes negative when El Niño is underway. For El Niño, the values must be sustained below -7, and the more negative the number the stronger the atmospheric signal.
In July 2026, the SOI averaged -29.1, which was the most negative value on record for July. To put that in context, the July value is roughly four times more negative than the threshold usually used to declare when El Niño is underway.
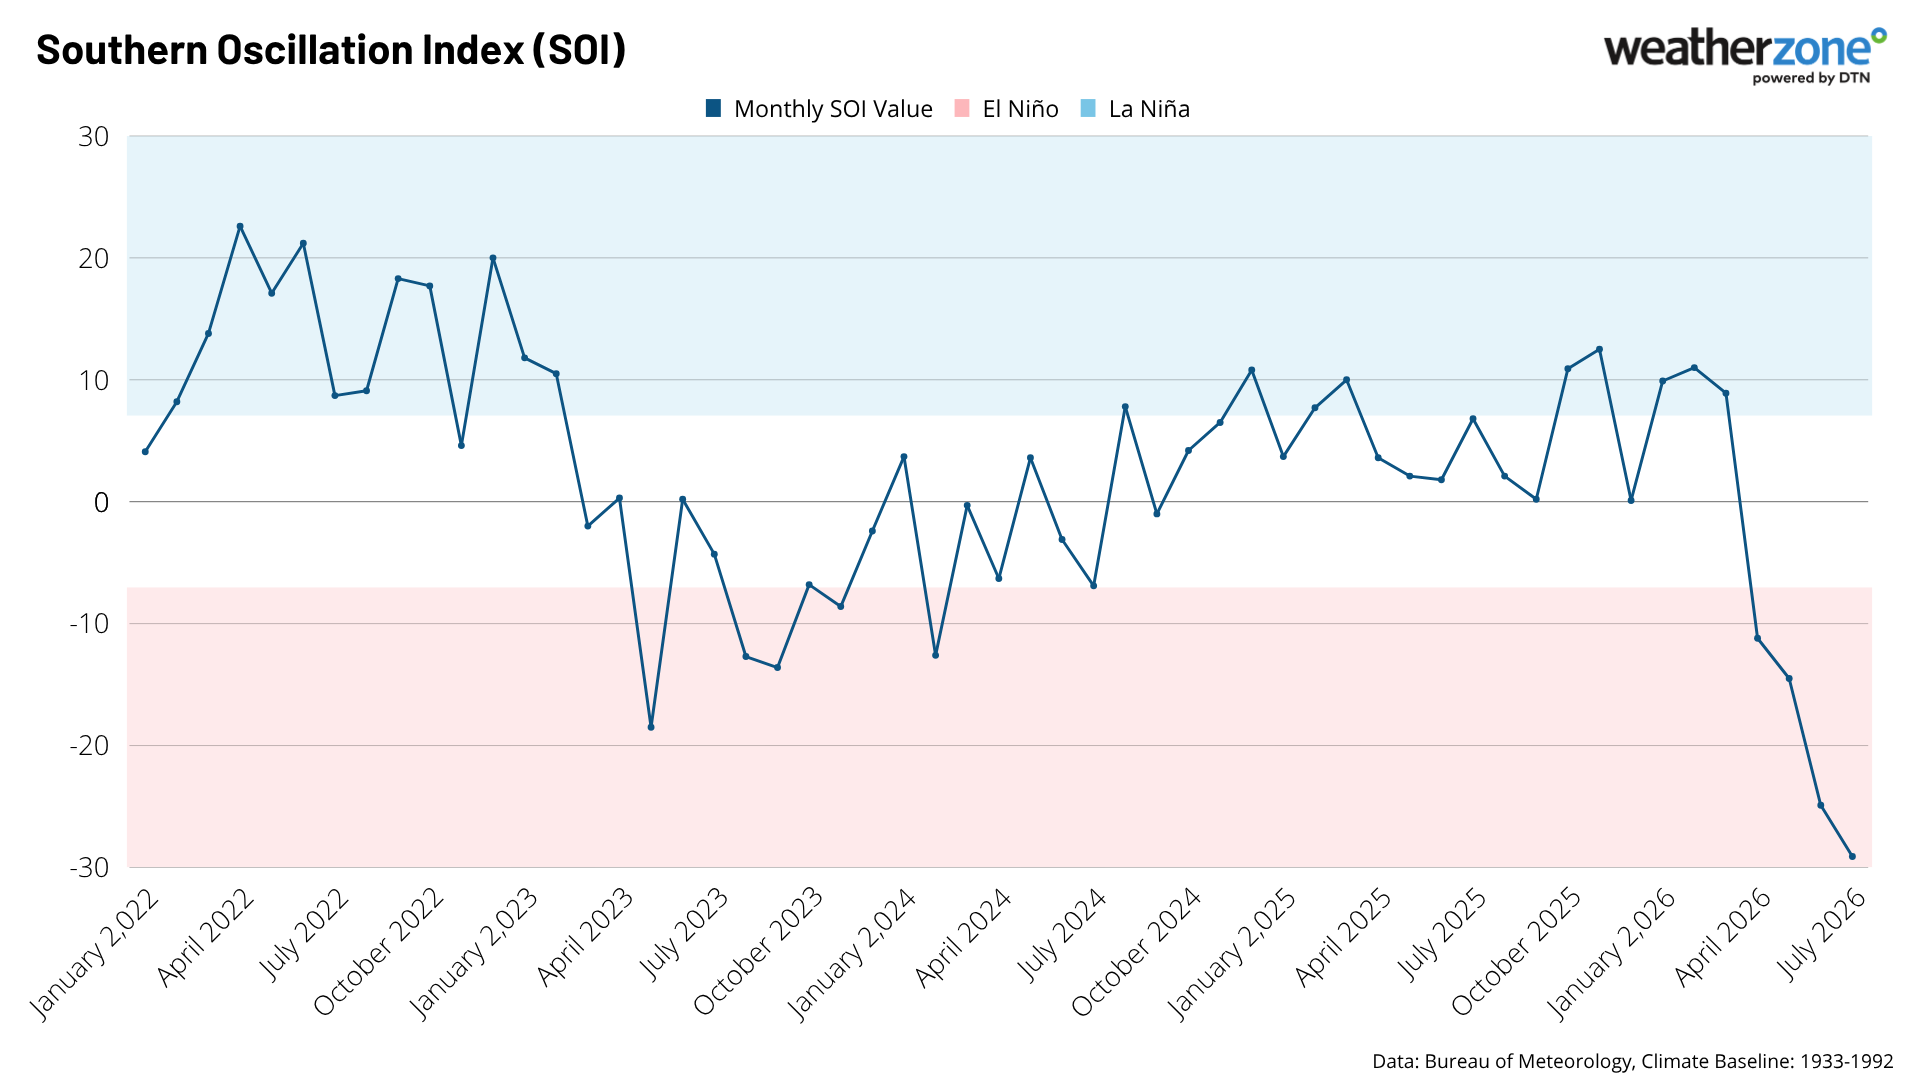
Image: Monthly SOI values between 2022 and 2026. Source: Weatherzone.
Why a strongly negative SOI matters for Australia
A deeply negative SOI reflects a weakening or reversal of the normal trade winds that blow warm, moist air toward the western Pacific. This suppresses tropical rainfall and monsoon activity, with less moisture available to fuel rain-bearing systems across Australia.
Historically, this pattern tends to bring:
- Below-average rainfall, particularly across eastern and northern Australia
- Above-average daytime temperatures, thanks to reduced cloud cover
- Elevated bushfire risk heading into spring and summer, as vegetation dries out
- Reduced river flows and water availability, especially in the Murray-Darling Basin
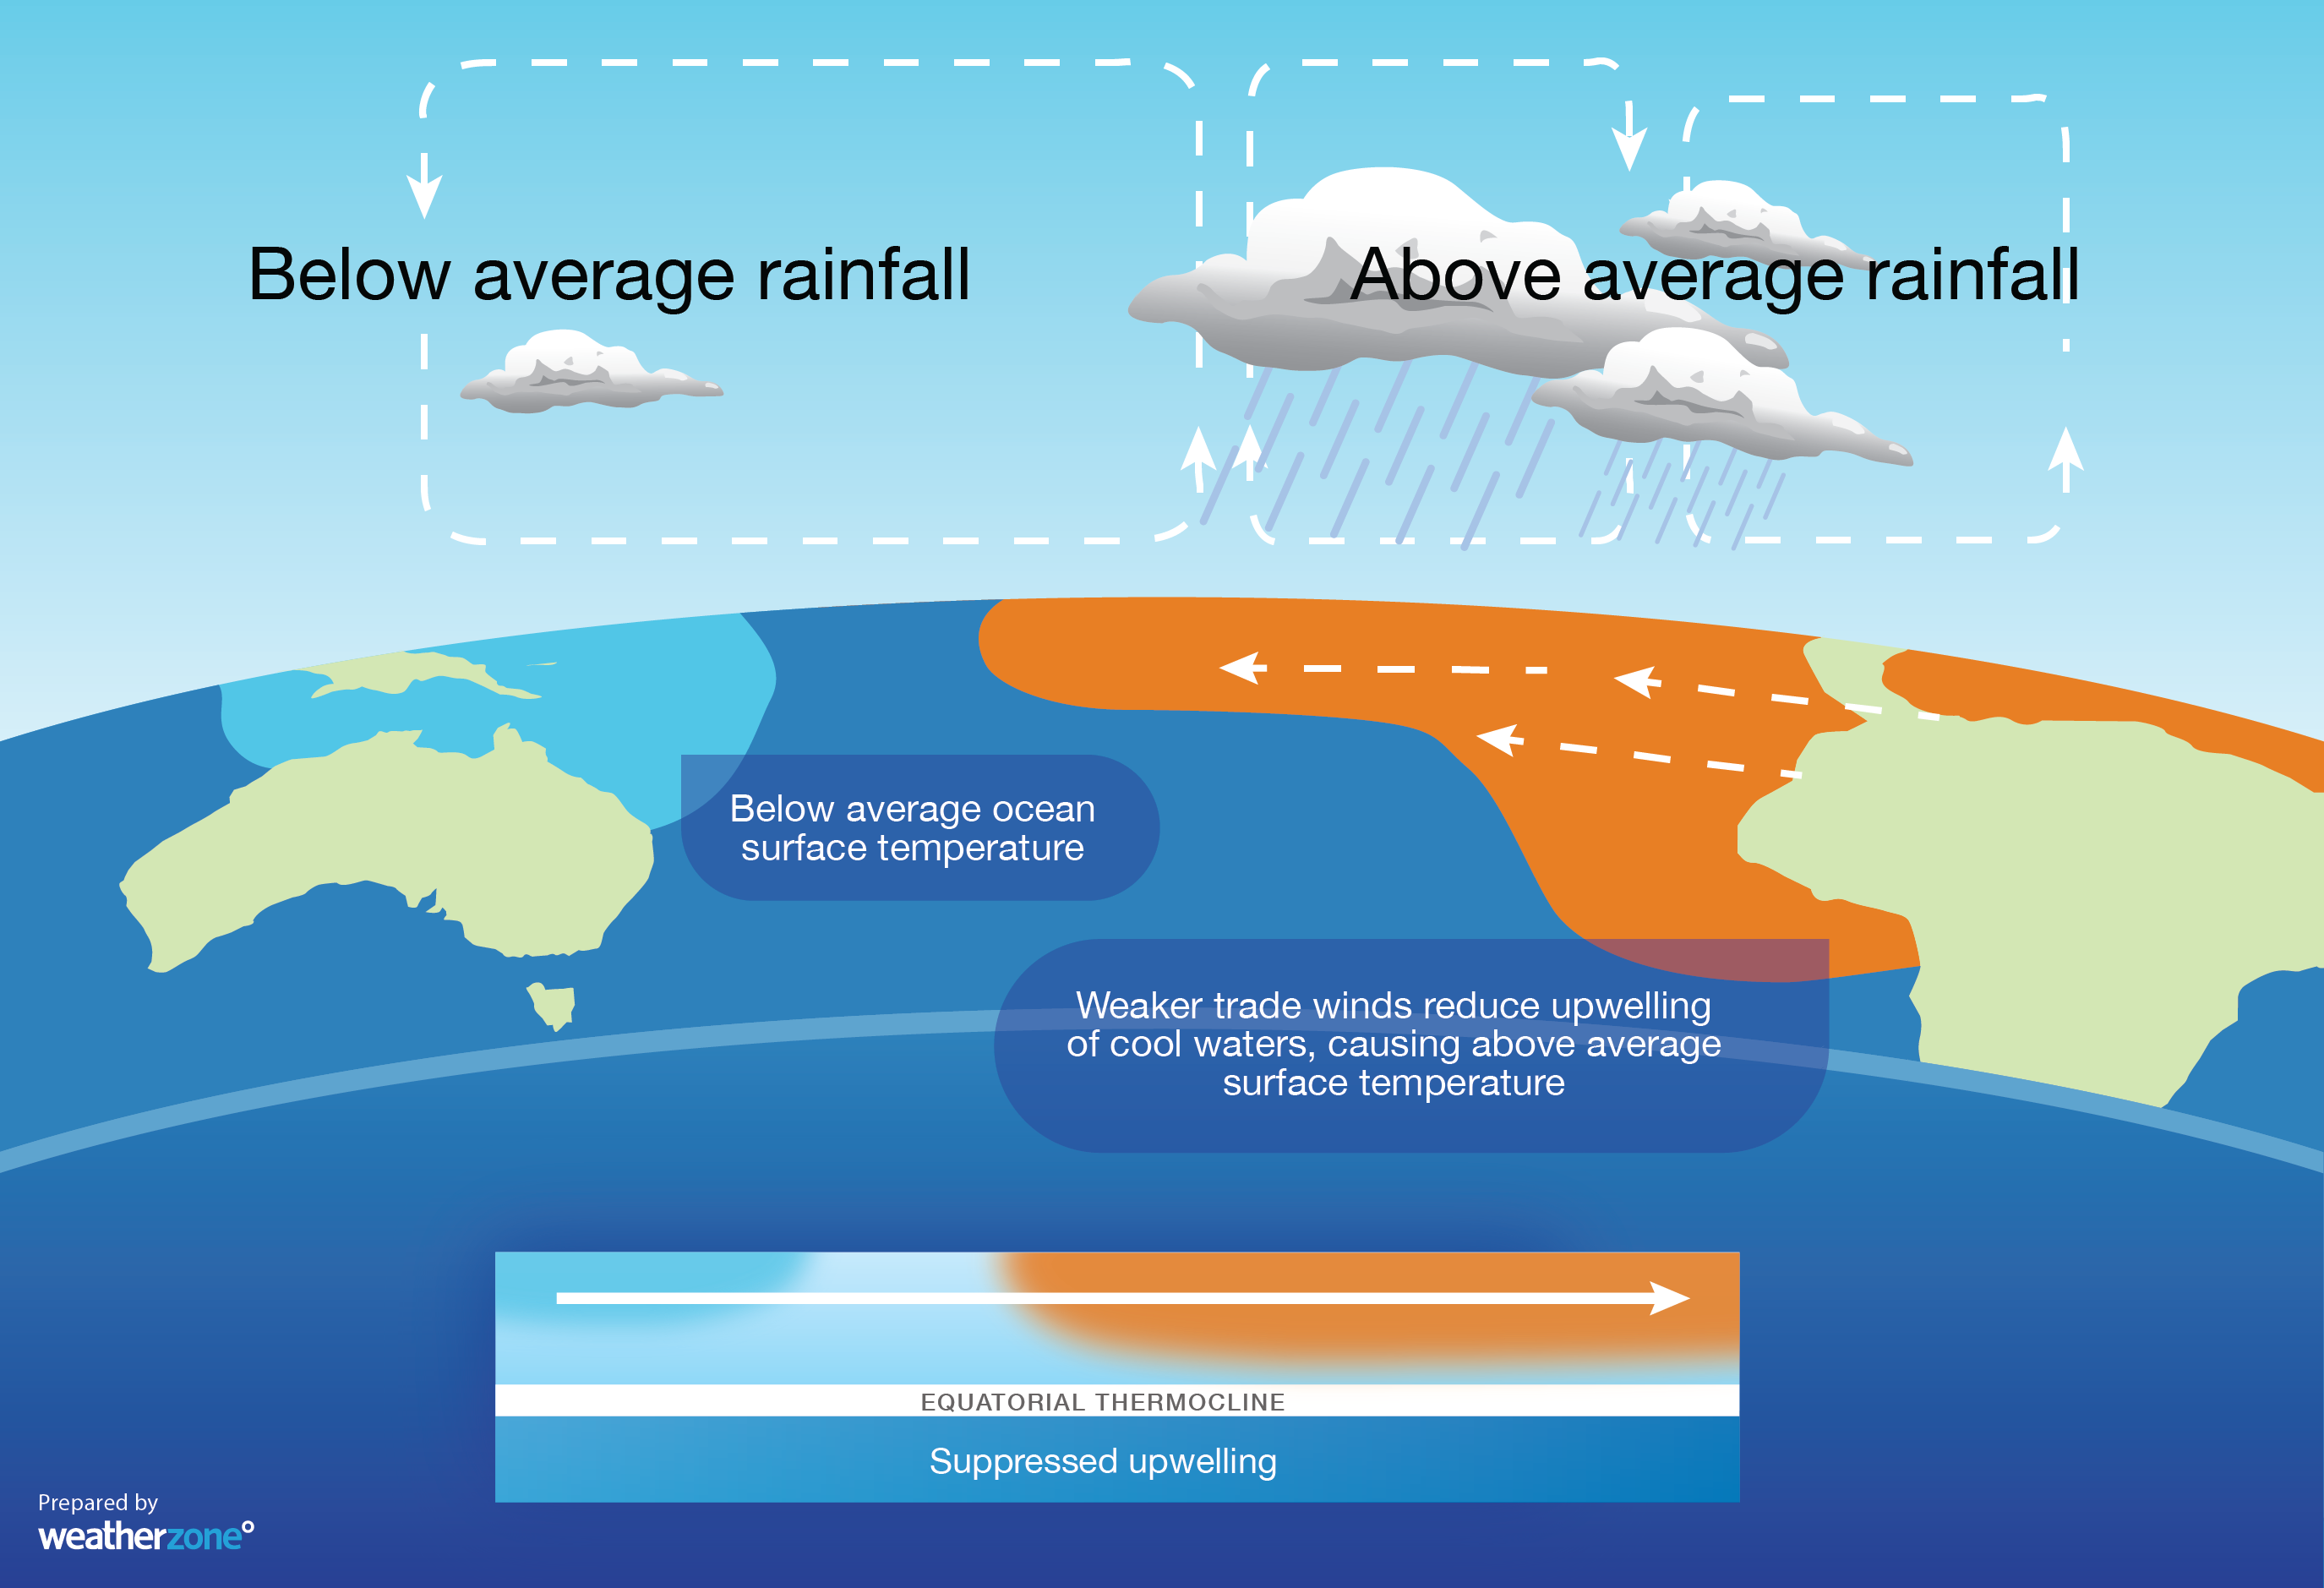
Image: Changes to ocean temperatures and atmospheric circulation during a typical El Niño pattern. Source: Weatherzone.
It’s important to note that while El Niño will increase the likelihood of the outcomes mentioned above in the coming months, they are not guaranteed. Other influences, including a potentially positive Indian Ocean Dipole (IOD) and unusually warm sea surface temperatures surrounding Australia will also play a role in influencing Australia's weather. For example, the abnormally warm seas near Australia will likely provide more moisture to increase humidity and fuel rain and storms this summer than a typical El Niño summer.
It’s also worth pointing out that while the 2026-27 El Niño is expected to peak during summer, the strongest link to rainfall is typically during spring.
Does a more extreme SOI mean larger impacts?
While a strongly negative SOI can increase the impacts we see in Australia, it doesn't always mean proportionally more severe impacts. The more negative the SOI, the weaker the trade winds, creating a self-sustaining circuit that firmly establishes the El Niño pattern in the atmosphere.
The more extremely negative SOI readings do tend to raise the odds of the classic El Niño impacts in Australia: hotter days, less rain, and higher fire risk. However, El Niño is also only one piece of the climate puzzle, with the Southern Annular Mode (SAM), various tropical waves, local sea surface temperatures and the Indian Ocean Dipole (IOD) all set to play a part in the weather we experience here in Australia this spring and summer.
How strong is this El Niño?
The latest weekly relative Niño3.4 index reading was +2.20°C for the week ending on August 08, comfortably past the threshold used to define a very strong El Niño above +2.0°C.
With record subsurface heat still available to feed this El Niño event, and the atmosphere already responding at record strength, most model guidance expects further strengthening into spring, with a peak likely between November and January.
According to data on the Bureau of Meteorology's website, the highest monthly relative Niño 3.4 value in records dating back to 1900 was +2.65°C in November 1902. The European model (ECMWF) currently forecasts the relative Niño3.4 index to reach +3.6°C in November this year, which would obliterate the old record by around 1°C. Given the anticipated strength of this El Niño event, it will likely last into at least autumn 2027.