
Negative IOD pattern gaining strength
The Indian Ocean Dipole index has just reached its most negative value since 2016, increasing the likelihood of wet weather over southeastern Australia in the coming months.
The Indian Ocean Dipole (IOD) is an index that measures the difference in sea surface temperatures on either side of the tropical Indian Ocean. This index is negative when water is abnormally cool on the western side of the Indian Ocean and unusually warm on the eastern side.

Image: Typical patterns of sea surface temperature and rainfall anomalies during a negative Indian Ocean Dipole.
Negative phases of the IOD are akin to La Niña in the Pacific Ocean because they enhance the flow of moisture-laden air towards Australia and promote rainfall.
Australia’s last negative IOD occurred from July to December in 2021, a period that included Australia’s wettest November on record. Prior to this, the most recent fully-fledged negative IOD was in 2016, which resulted in Australia’s wettest September on record and South Australia’s 4th wettest year on record.
So, what is the IOD going to do this year?
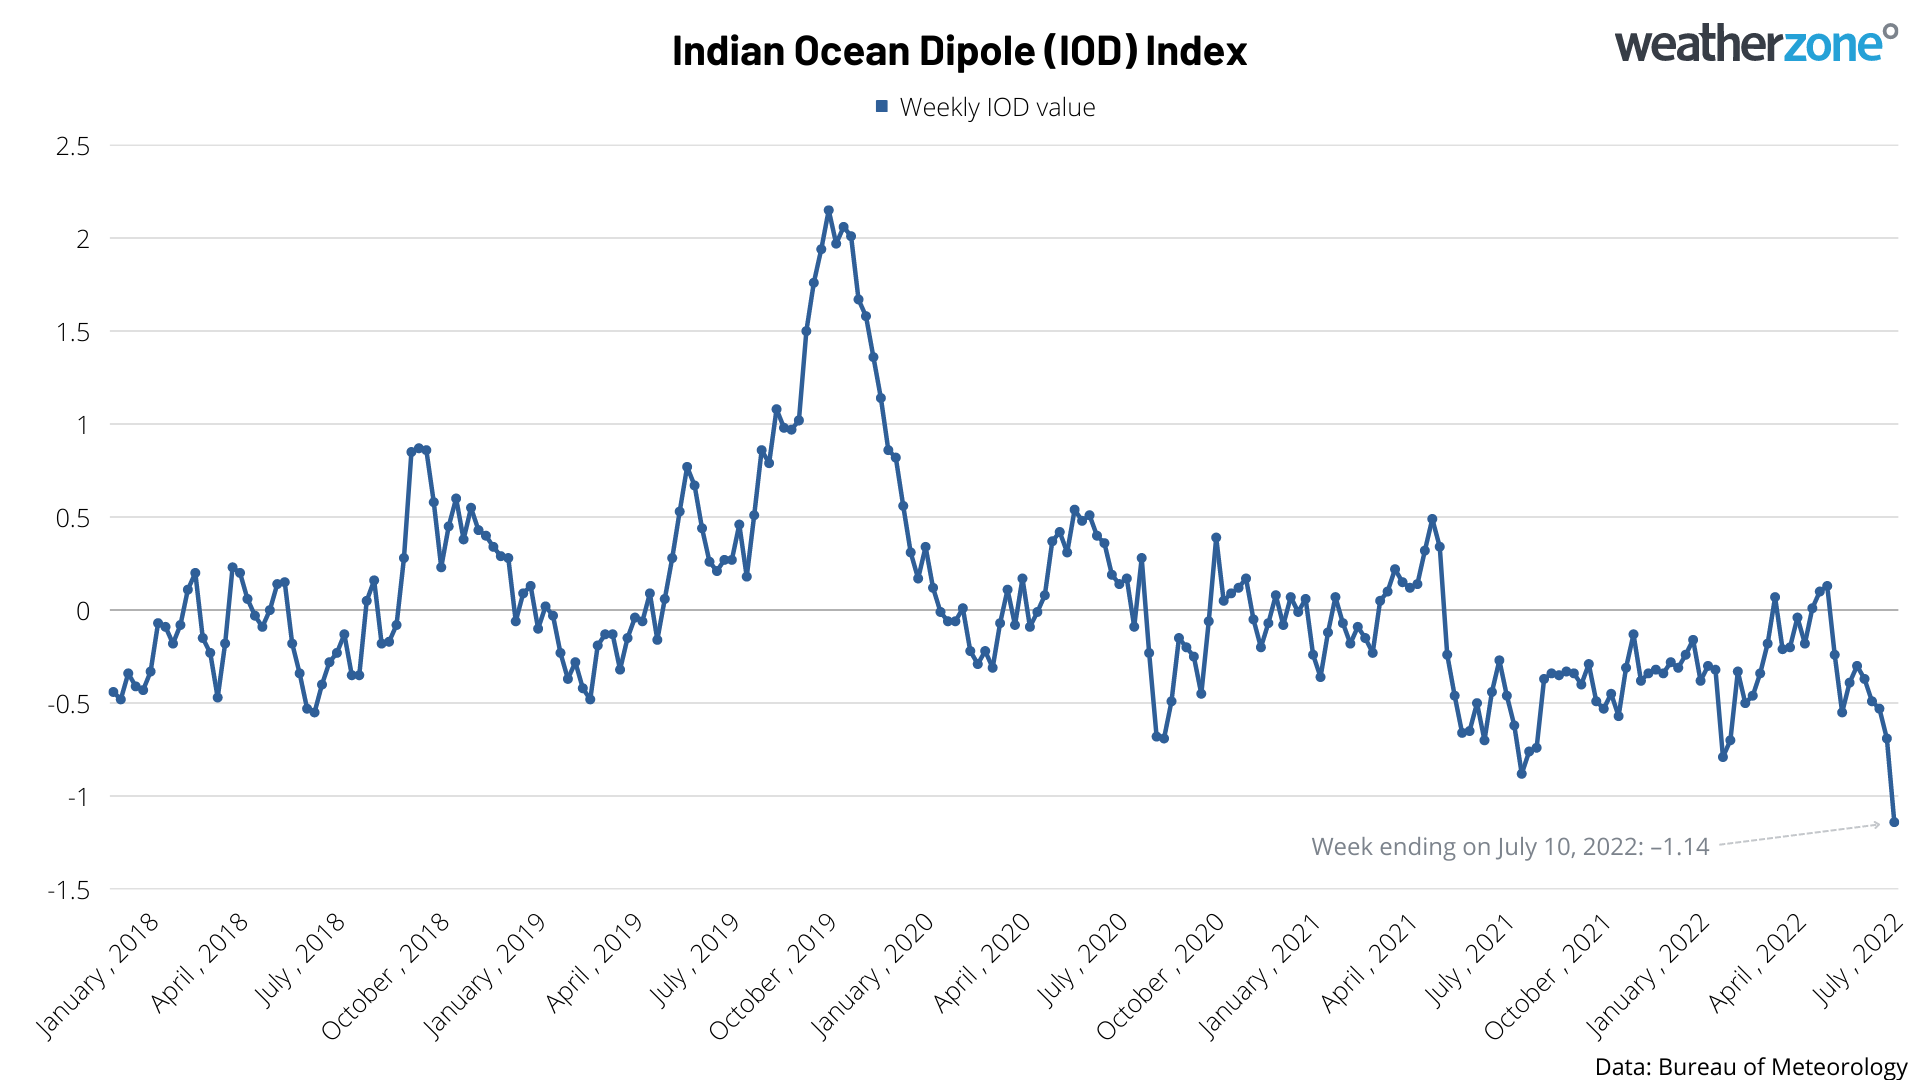
A negative IOD is usually declared when the IOD index remains below -0.4 for at least eight consecutive weeks.
The Indian Ocean has been transitioning into a negative IOD pattern over the last couple of months, with cooler-than-average waster pooling near the Horn of Africa and unusually warm water sitting to the northwest of Australia. This distinctive pattern can be seen on the map below.

Image: Sea surface temperature anomalies on July 9, 2022, in the two key IOD monitoring regions of the Indian Ocean. Source: NOAA
The oceanic temperature pattern above has seen the IOD index sitting in a negative state since mid-May and remaining near or below the negative IOD threshold of -0.4 during the past eight weeks. The latest weekly value for the week ending on July 10 was -1.14, which is the lowest IOD value observed since 2016. The graph below shows the state of the IOD index during the last four and a half years.
Most forecast models suggest that the IOD will remain in a negative state during the rest of the Southern Hemisphere’s winter and into spring, most likely gaining more strength in the coming weeks.
With eight weeks of the IOD index sitting near or below the threshold of -0.4, and more negative values on the horizon, it is only a matter of time before the Bureau of Meteorology declares a negative IOD officially underway. It may even happen later this week.
Negative IOD events typically cause above average rainfall over large areas of Australia, particularly in the south and southeast. They also promote cooler-than-average days across Australia’s southeast mainland.
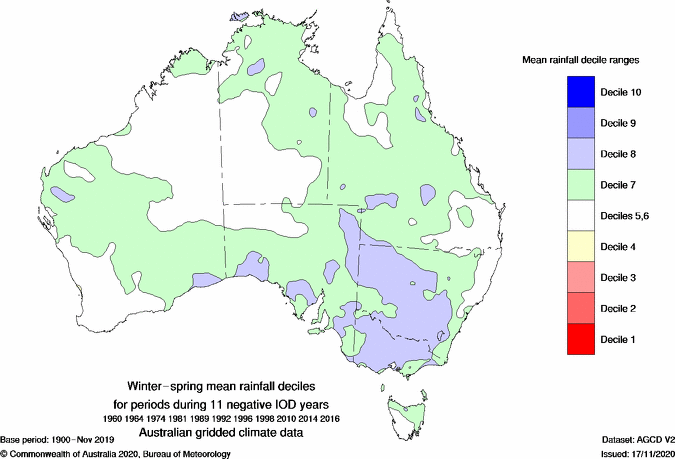
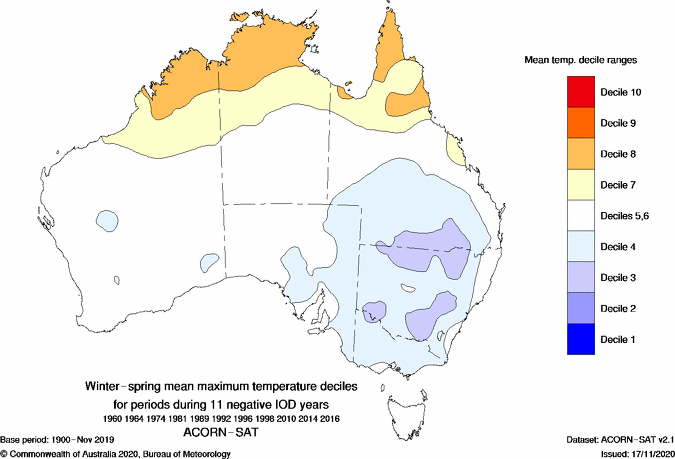
Images: Average observed rainfall (top) and maximum temperature (bottom) deciles during winter and spring for 11 negative IOD years that occurred between 1960 and 2016.