
Monitoring El Nino in a warming climate
Scientists are developing a new way to classify El Niño in a warming climate as rising ocean temperatures make existing methods less effective. This research, led by a team of international scientists, may even shed light on why the atmosphere has struggled to respond to this year’s developing El Niño.
Warm, warm water in the Pacific Ocean
Over the last few months, climate scientists and meteorologists around the world have been paying close attention to a large pool of unusually warm water at the surface of the central and eastern tropical Pacific Ocean.
This tongue of warm water, where sea surface temperatures have been hovering around 2 to 4ºC above average over the past few months, is a characteristic feature of El Niño.
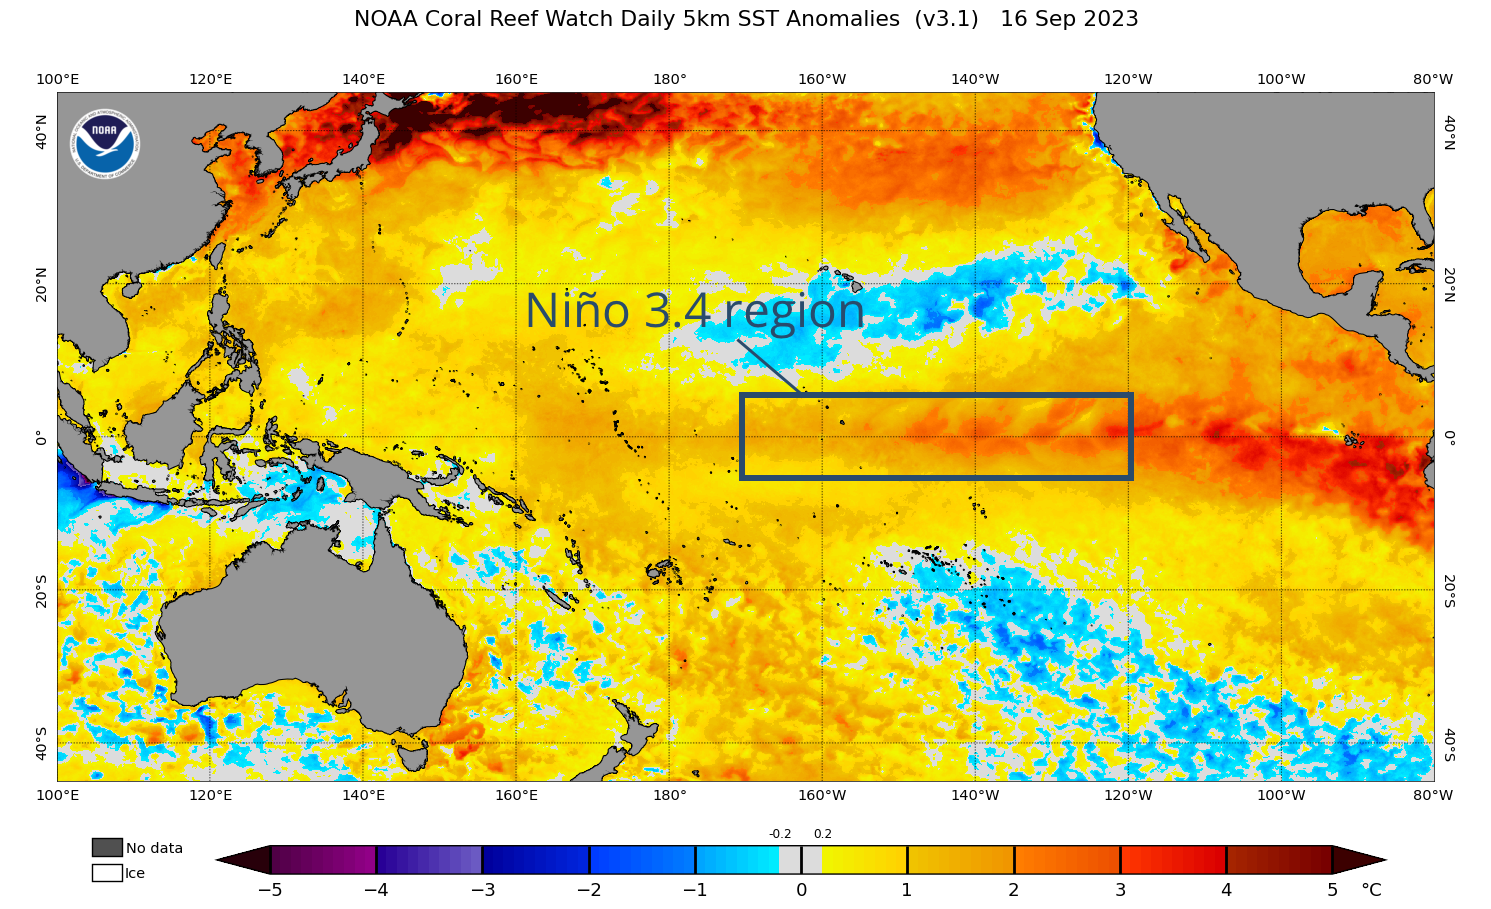
Image: Sea surface temperature anomalies in the Pacific Ocean on September 16, 2023, showing a pool of abnormally warm water in the central and eastern tropical Pacific. The key monitoring region for El Niño, known as the Niño 3.4 region, is highlighted.
However, El Niño is a ‘coupled’ ocean-atmosphere phenomenon, which occurs when the atmosphere above the tropical Pacific Ocean responds to, and reinforces, the underlying ocean warmth.
While the Pacific Ocean has been in a clear and strengthening El Niño state for the last few months, the atmosphere above it has been sluggish to respond. As a result, the Bureau of Meteorology is yet to officially declare that El Niño is underway.
So, why has the atmosphere been slow to respond to the warm tropical Pacific Ocean this year?
To answer this question, we need to first look at how El Niño is monitored.
Niño 3.4 temperature anomalies
Scientists have traditionally monitored the ocean component of El Niño by measuring sea surface temperature anomalies in a specific region of the central equatorial Pacific Ocean. This area, called the Niño 3.4 region, can be seen highlighted by the grey box in the image above.
When sea surface temperatures inside the Niño 3.4 region become sufficiently warmer than the western tropical Pacific, the atmosphere typically responds by increasing convection (more rising air) over the central tropical Pacific and suppressing convection (less rising air) above the western tropical Pacific.
These changes in convective activity often cause the Pacific Ocean’s trade winds, which usually blow from east to west, to weaken or even reverse. Once the ocean and atmosphere become coupled and begin reinforcing each other, El Niño is underway.
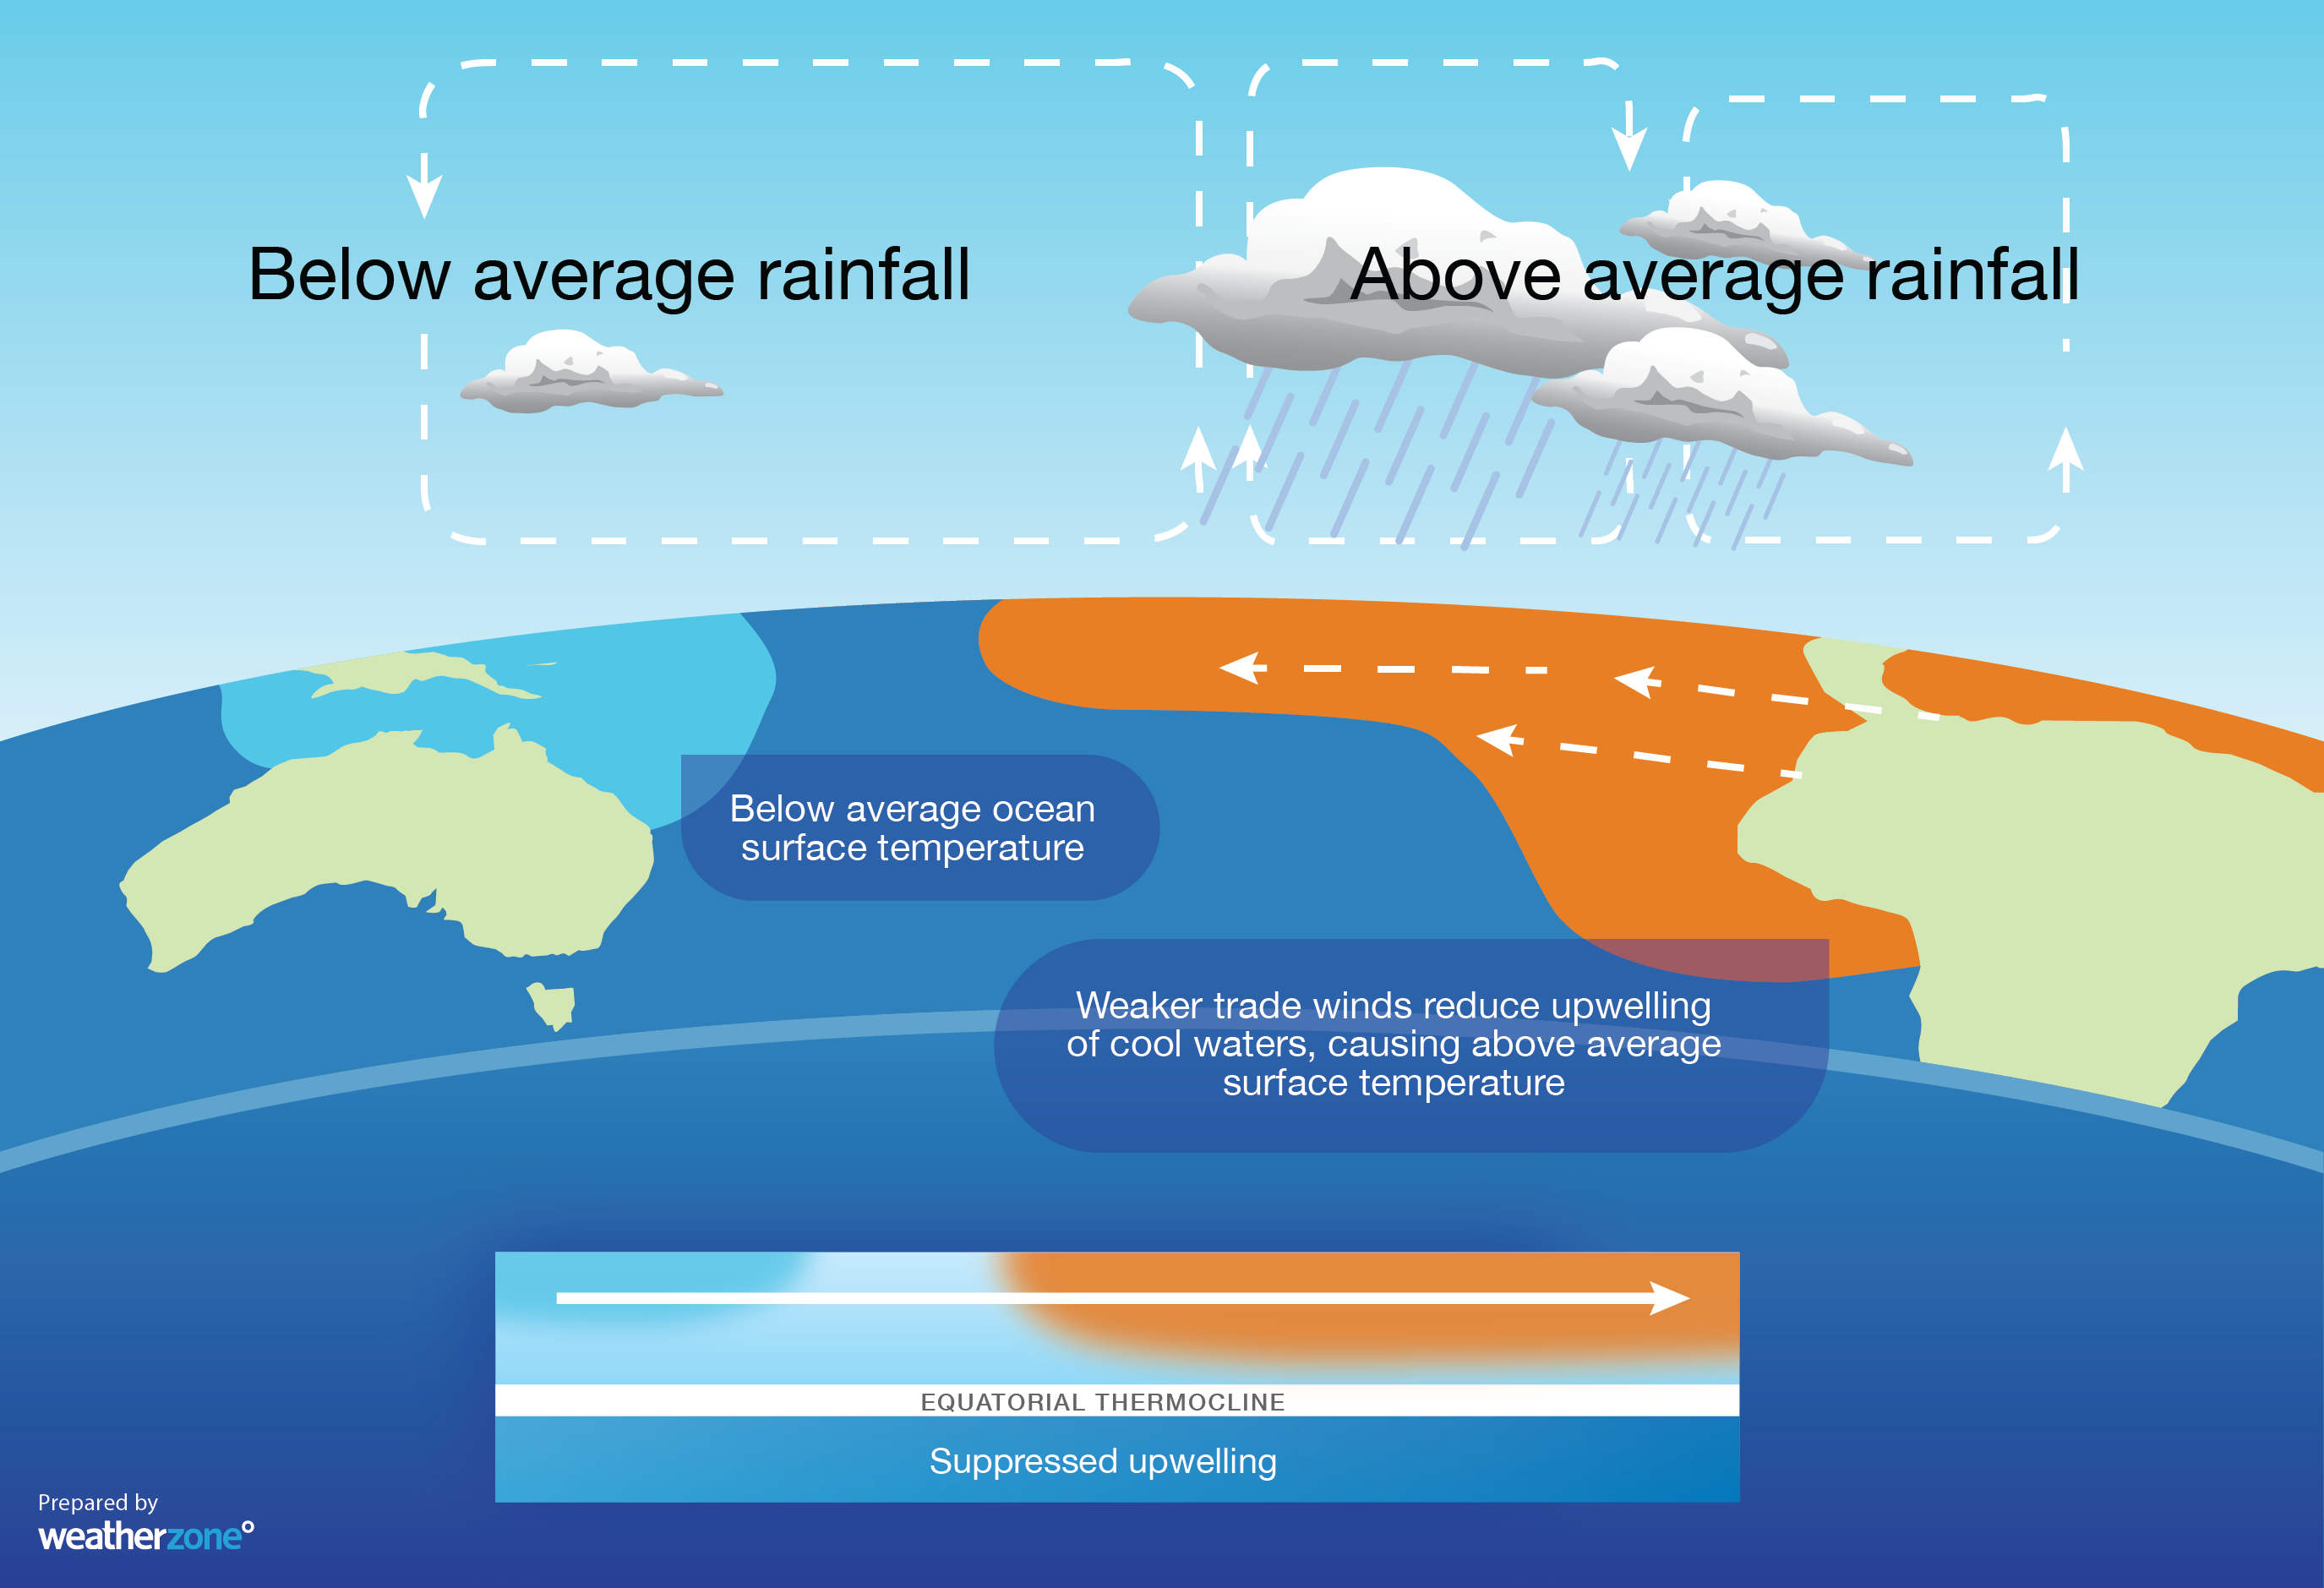
Image: Typical oceanic and atmospheric changes observed during El Niño.
El Niño can influence weather patterns around the world, often causing dry and hot weather in Australia, increased rain in parts of South America, and even suppressed hurricane activity in the Atlantic Basin.
El Niño in a warming climate
Unfortunately, the traditional methods for monitoring El Niño and predicting its impacts are becoming less effective in our warming climate.
El Niño occurs when sea surface temperatures in the Niño 3.4 region become sufficiently warmer than average. Australia’s Bureau of Meteorology uses a Niño3.4 temperature anomaly of 0.8ºC or higher to classify the oceanic component of El Niño, while the U.S. National Oceanic and Atmospheric Administration (NOAA) use a slightly lower threshold of +0.5ºC.
At present, Niño3.4 temperature anomalies are calculated against a standard 30-year reference period, which is currently 1961-1990 for the BoM and 1991-2020 for NOAA.
But while using 30-year baselines has been a suitable technique for monitoring El Niño and La Niña in the past, recent research suggests that global ocean temperatures are rising so fast that this method is becoming less effective in the modern climate.
According to NOAA’s ESSRTv5 dataset, the mean global ocean temperature rose by about 0.15ºC per decade between 2000 and 2022. This rapid warming means that a global ocean temperature anomaly of 0.5ºC in today’s climate is warmer, in absolute terms, than the same anomaly was 30 years ago.
This warming trend in our planet’s oceans is making it difficult to keep using 30-year baseline periods for monitoring El Niño and La Niña.
Relative Niño3.4 index
Fortunately, scientists have come up with a way to replace the increasingly ineffective 30-year baseline approach with something that better reflects the current climate.
The new approach uses a ‘relative Niño3.4’ index, which compares the Niño3.4 temperature anomaly to the concurrent sea surface temperature anomaly of the planet’s entire tropical oceans.
The relative Niño3.4 index allows climate scientists to quickly see how ocean temperatures in the Niño3.4 region compare the surrounding tropical oceans in real time.
This real-time comparison is important because the main thing that drives El Niño and La Niña events is the contrast in sea surface temperatures across the tropical Pacific Ocean. When the entire tropical oceans are warm, the Niño3.4 temperature must get even higher, in relative terms, to initiate convection.
What about this year’s El Niño?
Comparing the new relative Niño3.4 index to the traditional Niño3.4 index may help explain why the atmosphere has been struggling to respond to the warming central tropical Pacific Ocean in recent months.
Based on NOAA’s ERSSTv5 dataset, sea surface temperatures in the Niño3.4 region were 1.06ºC above the 1991-2020 average during the three-month period ending in August 2023. The relative Niño3.4 value for the same period was only 0.64C.
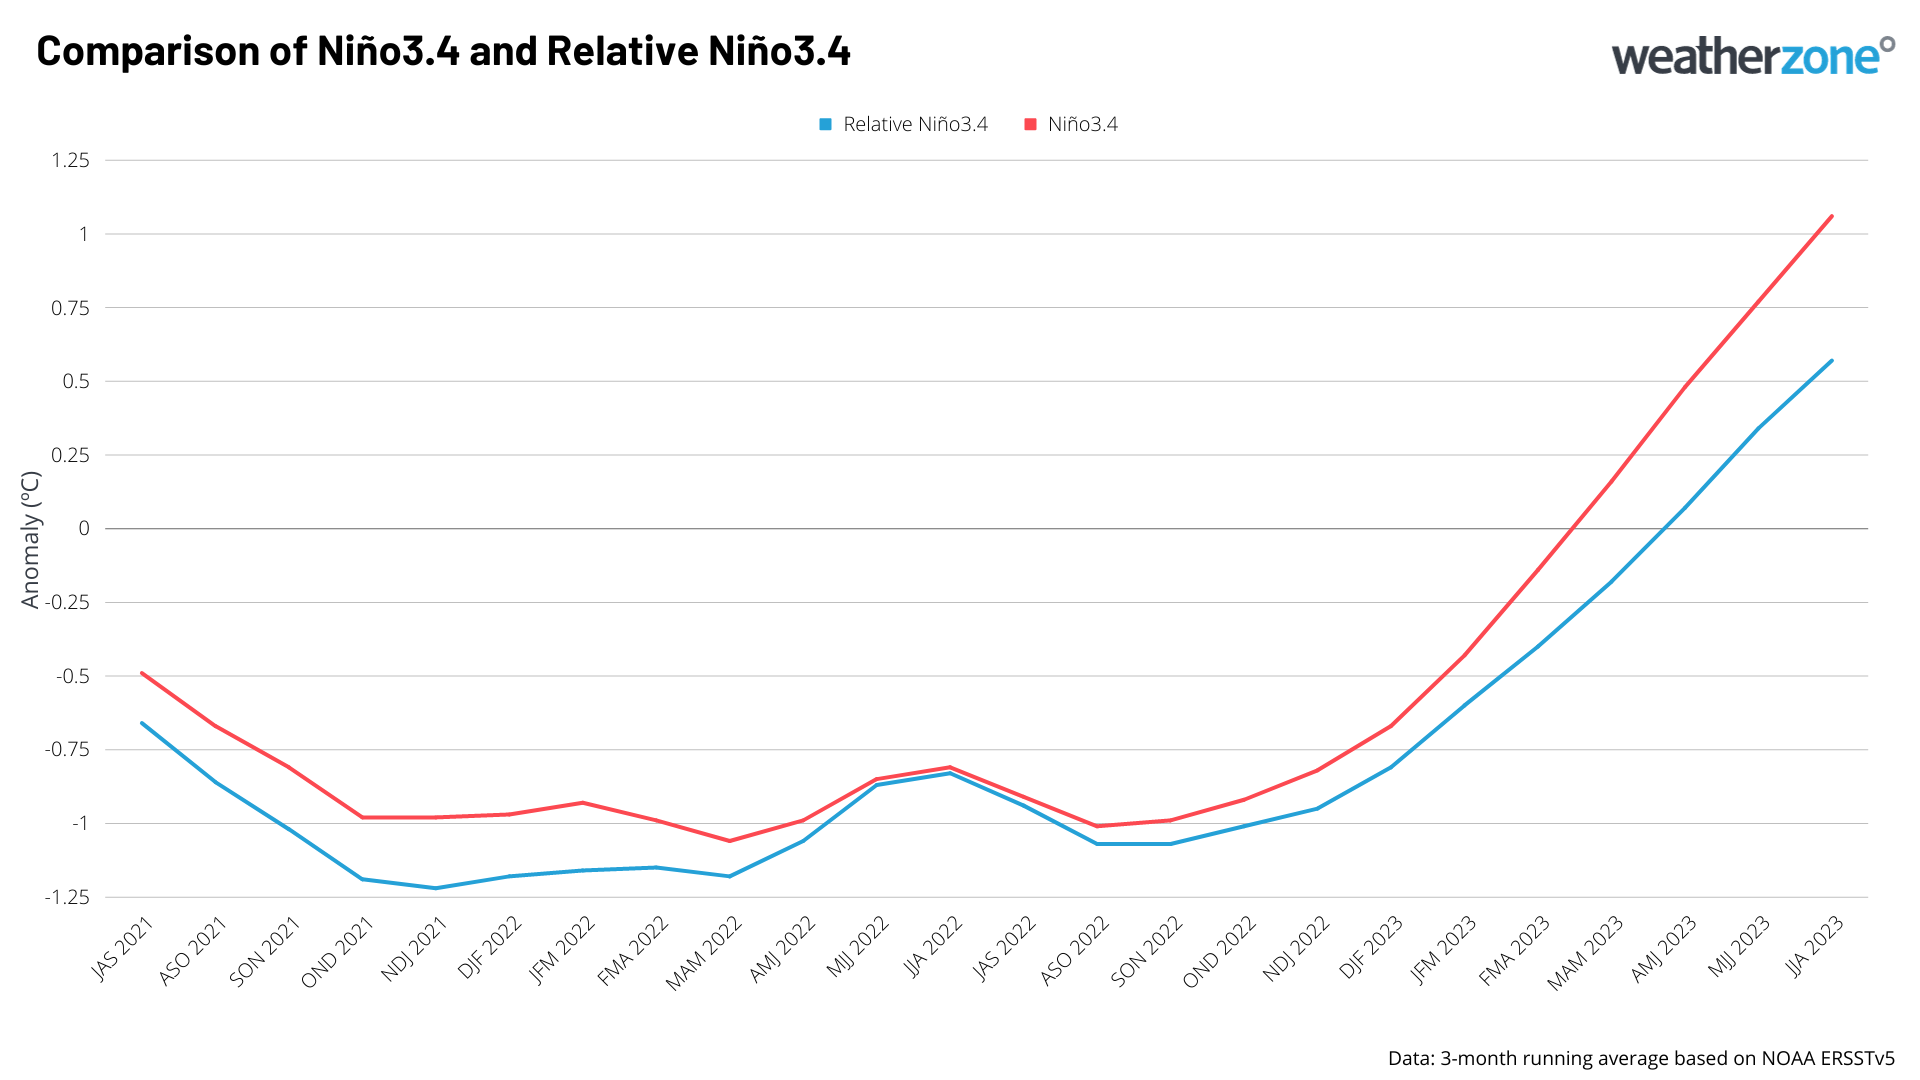
Image: Three-month average Niño3.4 and relative Niño3.4 anomalies during the past two years.
This 0.66ºC difference between the two indices in August is quite large, considering 0.6ºC is enough to separate a strong El Nino from a weak El Niño based on NOAA’s Niño3.4 anomaly ranges:
- Weak El Niño= 0.5 to 0.9ºC above average
- Moderate El Niño = 1.0 to 1.4ºC above average
- Strong El Niño = 1.5ºC and more above average
Climate scientists have been closely watching the Pacific Ocean this year see how the planet’s record-breaking ocean temperatures may be influencing the development of El Niño.
According to Michelle L’Heureux from NOAA’s Climate Prediction Center, the relative Niño3.4 index has been running around 0.5ºC below the traditional Niño3.4 index for the last few months.
This difference suggests that this year’s abnormally warm oceans may be contributing to the atmosphere's sluggish response to the warm water in the central tropical Pacific Ocean.
“The tropical mean sea surface temperature anomaly is fairly high and, I suspect, is holding back some of the coupled responses,” L’Heureux said.
Harry Hendon is a former Bureau of Meteorology researcher and co-author of the paper proposing a relative Niño3.4 index. He agrees that this year’s record-breaking ocean temperatures are likely playing a role in hindering El Niño’s atmospheric response.
“The incredible global mean ocean temperature, and to a lesser degree the tropical mean ocean temperature, means that the apparent Niño3.4 temperature is lower than what you get using just the standard value.
“The widespread warmth means that the convective threshold temperature has gone up, so you need a bigger Niño3.4 index value to trigger convection in the Niño3.4 region.”
“I am sure this has played into why there is such sluggish coupling to the atmosphere with the current El Niño,” Hendon said.
El Niño still likely this year
Despite a relatively weak atmospheric response above the tropical Pacific Ocean in recent months, we are now starting to see clearer signs of coupling between the ocean and the atmosphere.
The Bureau of Meteorology’s latest climate driver update, published on September 12, stated that “the 90-day Southern Oscillation Index (SOI) is currently -7.4, exceeding El Niño thresholds. Trade winds for August 2023 were slightly weaker than average across the Pacific for the first time since January 2020. Other atmospheric indicators have also recently shown signs of possible coupling between the Pacific Ocean and the atmosphere.”
Scientists at the U.S. NOAA are also seeing signs that the ocean-atmosphere coupling which underpins El Niño is staring to take place.
These recent indications of coupling increase the likelihood that the Bureau will declare an official El Niño event this spring. This increases the likelihood that large areas of Australia will see above average temperatures, below average rain and increased fire danger during the rest of spring into early summer.
One important thing to keep an eye on in the next few months will be how strong this El Niño gets, because the stronger the El Niño, the more likely we are to see its impacts.

Image: Forecast Niño3.4 temperature anomalies between now and February next year, according to the Bureau of Meteorology’s ACCESS-S model.
Most international forecast models predict that we are about to see a strong El Niño event, which should gain more strength in the back end of 2023 and persist until at least early next year.
But with this event unfolding against a backdrop of record-breaking ocean warmth, the relative Niño3.4 index will be an important tool for keeping track of the developing El Niño and its global impacts.