
La Niña more likely this year after BoM switches to new index
The likelihood of La Niña occurring in 2025 has increased due to a change in the way the Bureau of Meteorology calculates sea surface temperature anomalies in the tropical Pacific Ocean.
What is La Niña?
La Niña refers to a distinct pattern of sea surface temperatures across the tropical Pacific Ocean. When La Niña is occurring, it affects weather patterns on a global scale.
La Niña occurs when cooler than average water develops at the surface of the central and eastern equatorial Pacific Ocean, and warmer than average water sits at the surface of the western tropical Pacific Ocean.
This pattern of sea surface temperature anomalies typically enhances cloud and rainfall over the western Pacific, including parts of Australia. It also changes how weather behaves in other parts of the world.

Image: Typical global impacts of La Niña during the Southern Hemisphere’s summer (December to February). Source: NOAA
How is La Niña measured?
The primary method for monitoring La Niña is to calculate sea surface temperature anomalies in a region of the central equatorial Pacific Ocean known as the Niño-3.4 region.
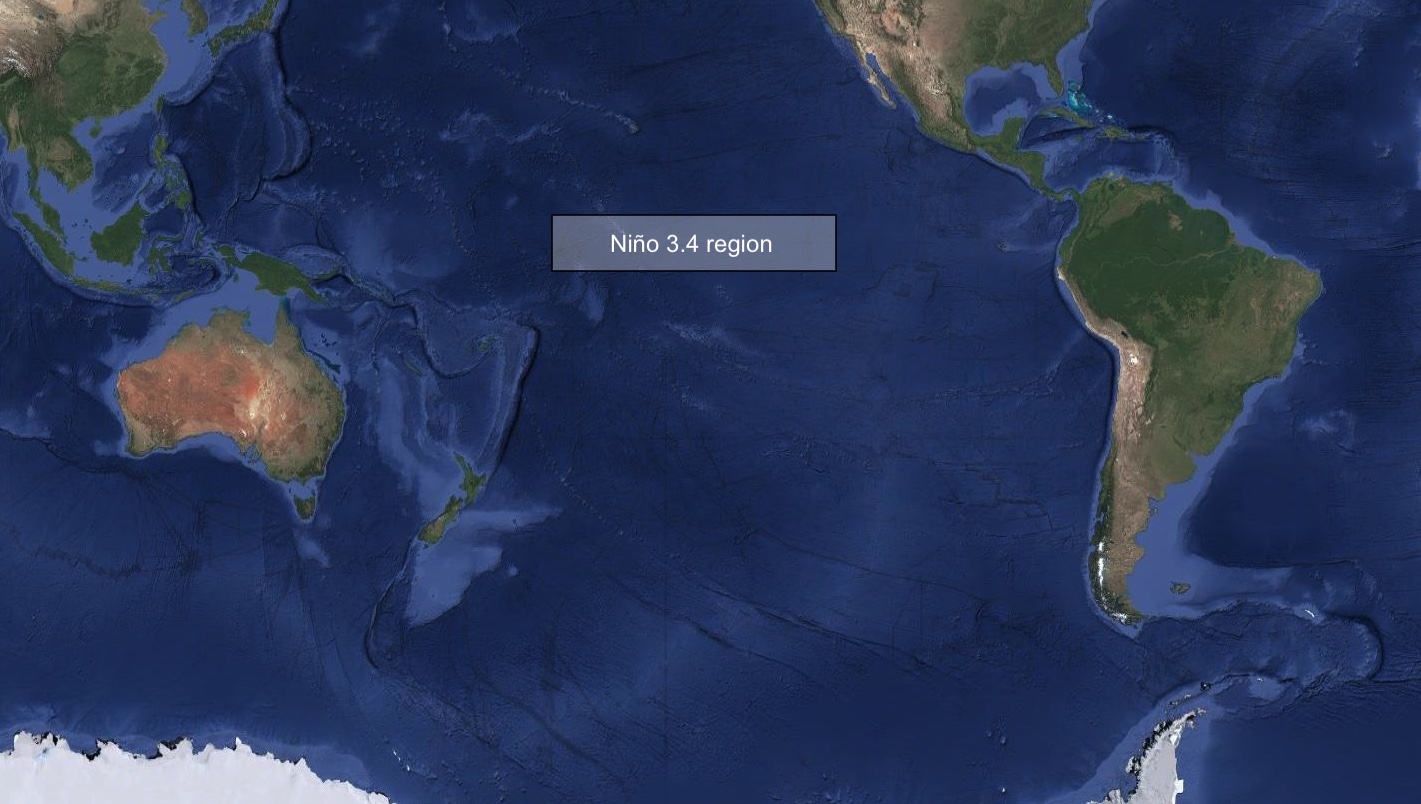
Image: Niño 3.4 region.
When sea surface temperatures in the Nino 3.4 region are sufficiently cooler than average for several consecutive months, La Niña is underway. According to the Bureau of Meteorology’s thresholds, the Niño 3.4 index needs to be lower than -0.8°C for three consecutive months for La Niña to be occurring.
La Niña in the modern climate
The Bureau of Meteorology has just changed the way it calculates sea surface temperature anomalies for monitoring La Niña (and El Niño).
Traditionally, sea surface temperatures inside the Niño 3.4 region were compared to the long-term average of the 30-year period from 1991 to 2020. The difference between the current temperature and the long-term average temperature gave us the anomaly used for monitoring La Niña.
However, rising global ocean temperatures caused by climate change have made this method ineffective. Put simply, Earth’s oceans are warming so quickly that the average ocean temperature of the past 30 years is cooler than the current global ocean temperature. This makes Niño 3.4 index values artificially warm when calculated using the traditional method.
Instead of comparing the current state of the ocean to a baseline from the past climate, scientists have developed a new method that also incorporates the current average temperature of the global tropical oceans. This new method, with is called the relative Niño index, removes the climate change signal from the equation and makes it more useful in our rapidly warming climate.
What is La Niña doing now?
Based in the relative Niño index, forecast models suggest that the Niño 3.4 index will hover around -0.9°C to -1.0°C for the next three months, with a 45 to 75% chance that it will stay below the -0.8°C threshold needed for La Niña.
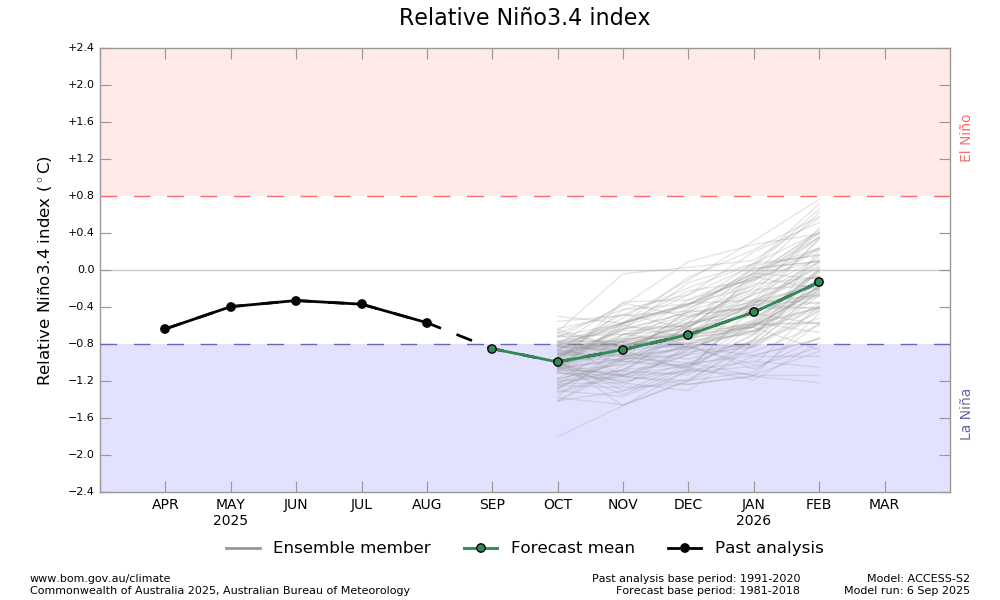
Image: Niño 3.4 index forecast for the next 5-6 months. Source: Bureau of Meteorology.
While La Niña was unlikely to occur in 2025 using the now old method of calculating ocean temperature anomalies, it is now more likely in 2025 based on the relative Niño index.
Australian seasonal outlooks are reflecting the influence of a developing La Niña signal, with above average rain predicted over large areas of the country’s north and east during the last three month of 2025.
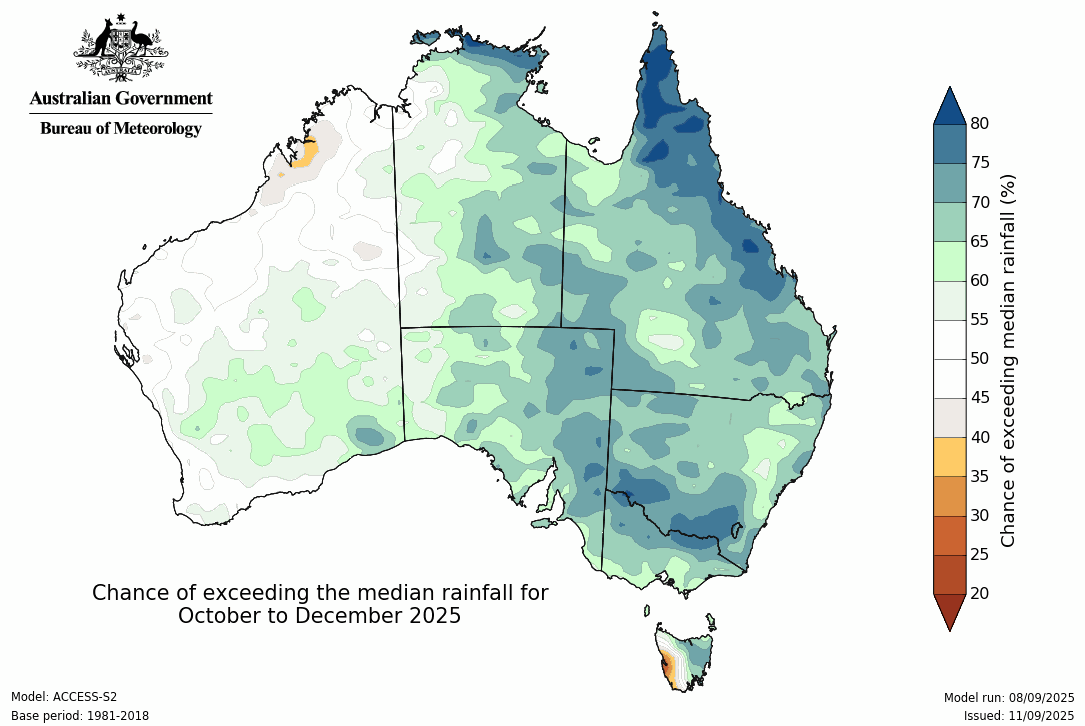
Image: Rainfall outlook for October to December 2025. Source: Bureau of Meteorology.
The increased cloud cover and rain associated with the potential La Niña may also help suppress daytime temperatures over parts of eastern Australia during late spring into early summer.