
Is a 'Super El Niño' on the way?
La Niña is on its way out, and there are signs that the Pacific Ocean could transition to an El Niño pattern later this year. Some forecast models are even hinting at a super El Niño emerging before the end of 2026.
A big change is afoot in the equatorial Pacific Ocean. For a few months it has experienced a weak La Niña, with sea surface temperatures a little lower than normal; but warmer water is now starting to expand as we see the beginning of a transition in ENSO: the El Niño-Southern Oscillation. This is the natural climate pattern that, roughly every 1 to 3 years, slowly cycles between La Niña (cool phase) and El Niño (warm phase).
The departing La Niña helped to shape atmospheric circulations through the winter, not least across North America, and patterns still reflect a base La Niña state. But La Niña is now on its last legs, with ENSO now entering a neutral phase on its way to El Niño developing through the summer. Indeed, far eastern and western parts of the tropical Pacific are already warming above average, and the central region should gradually catch up.
.gif)
Image: Weekly sea surface temperature anomalies for the first week of March, showing cool anomalies in the central equatorial Pacific flanked by warming seas to the west and east. Source: NOAA/PSL.
El Niño expectations
So, what might we expect from this emerging El Niño? Firstly, it should be pointed out that El Niño is not 100% guaranteed. However, there are strong indications that it will develop, with most models pointing towards continued warming of the tropical Pacific through the spring and summer; and confidence will rise once we are through what is known as the ‘spring predictability barrier’. This describes the difficulty that models encounter when they are initialized in early spring and try to predict ENSO developments on the other side of spring.
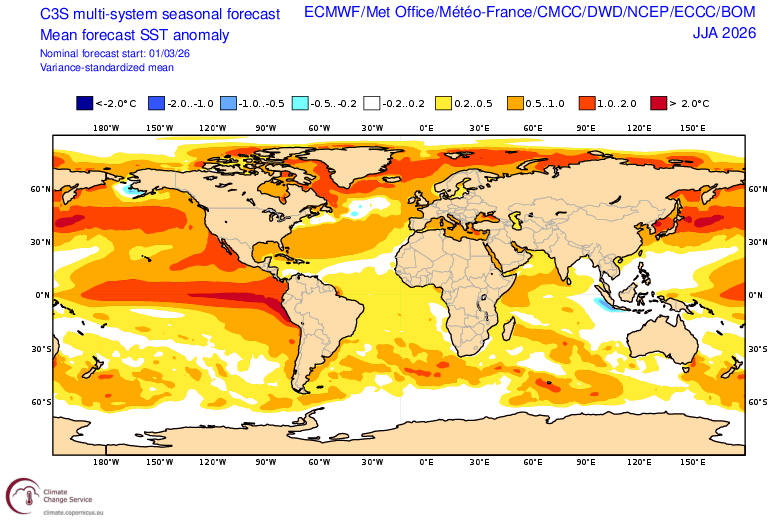
Image: C3S multi-system forecast of mean sea surface temperatures from June to August, showing warming waters and emerging El Niño across the tropical Pacific Ocean. Source: ECMWF.
Models can struggle with the volatility of Earth’s weather and climate system, especially during springtime when signals tend to be weaker. Sea surface temperature anomalies are usually weaker and subject to more change than during winter when El Niño or La Niña are closer to their peak strength. It is inherently more difficult to forecast a changing system, just as it is harder to hit a moving target.
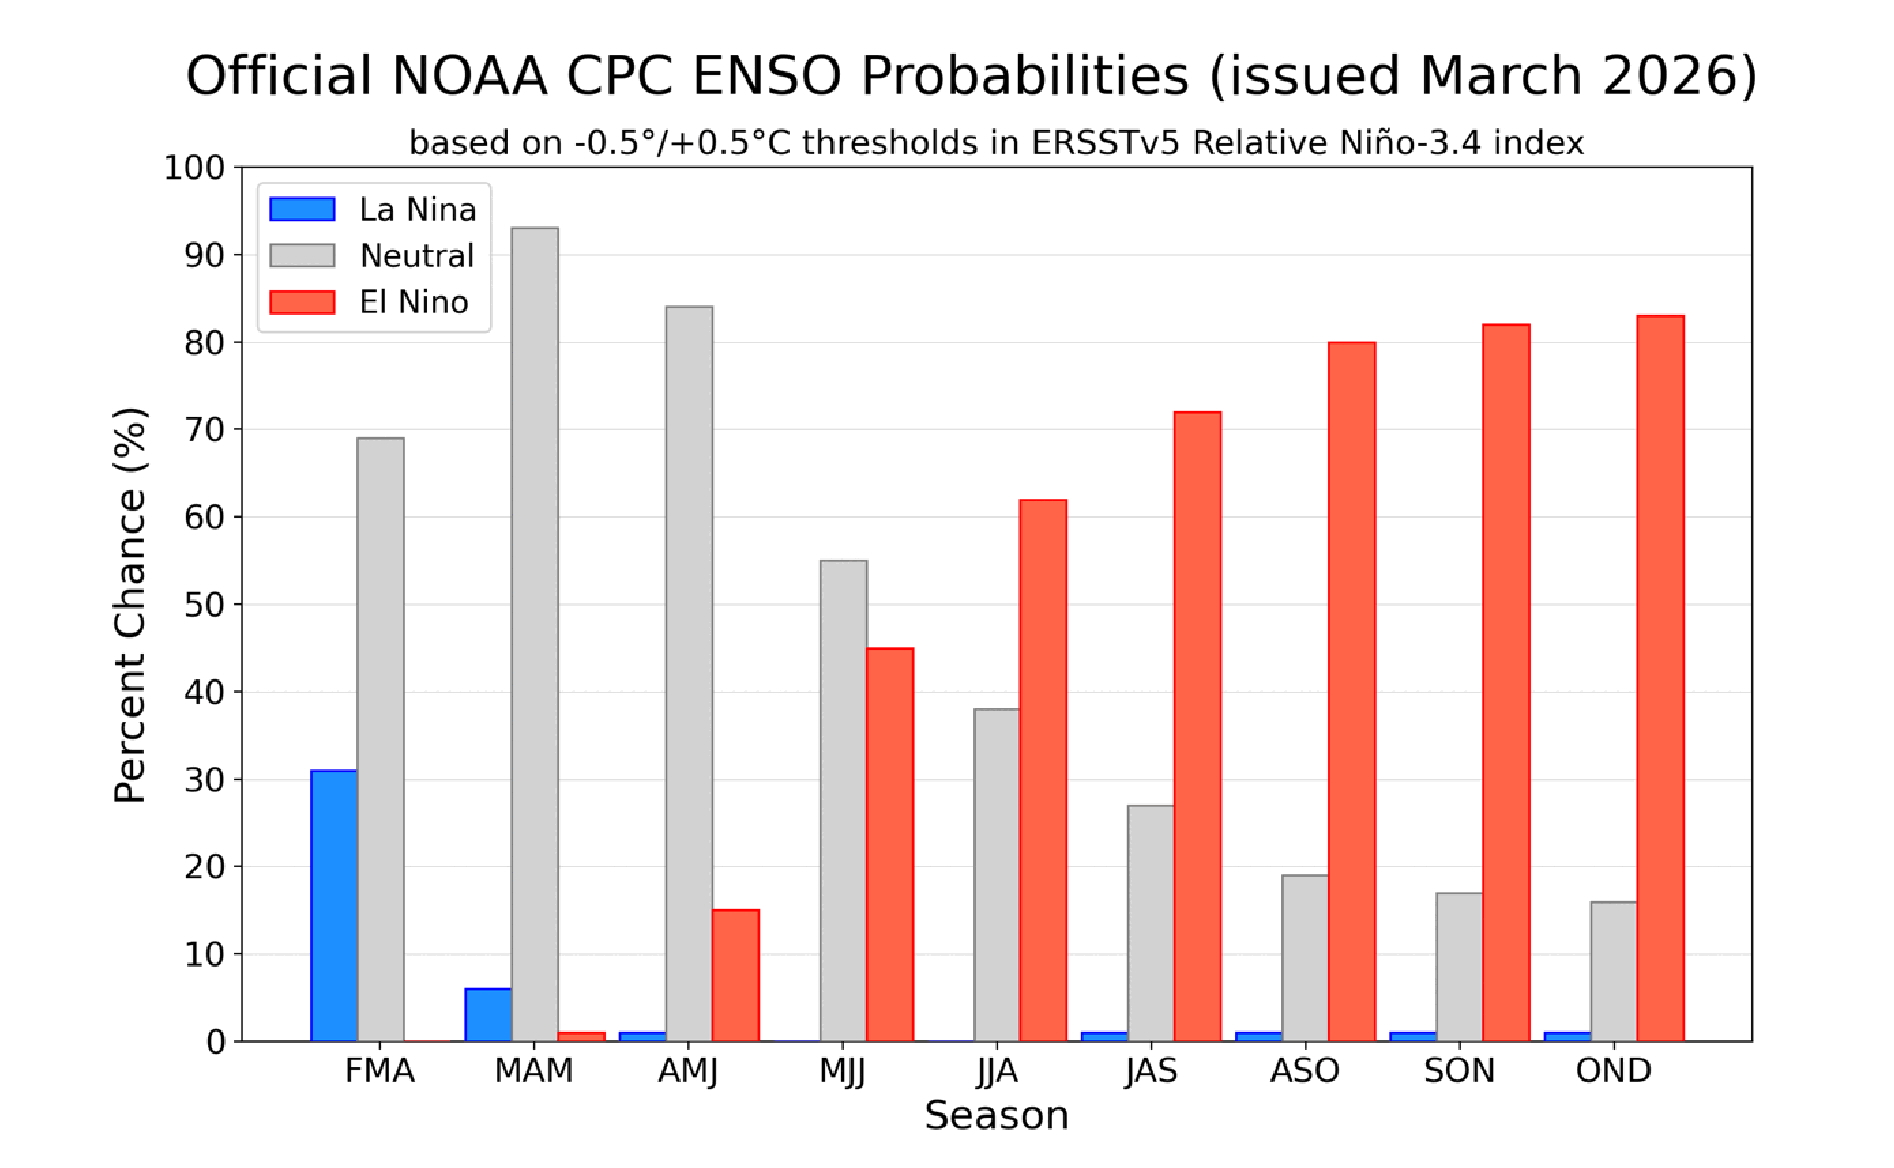
Image: NOAA Climate Prediction Center probabilities for the Niño 3.4 region SST for three-month periods during 2026. Colored bars represent the percent chance of La Niña (blue), El Niño (red), and ENSO-neutral (gray). Source: NOAA.
Probabilities
Having said that, the spread of model solutions is not as wide as it has been in many previous years, and nearly all indicate at least a minor warming trend. Moreover, many are showing the possibility of strong warming across the tropical Pacific. If the average temperature anomaly were to increase to at least 2 deg C or 3.6 deg F above normal, then that would fulfil the broad definition of a ‘Super El Niño’. Currently, a 20-30% probability can be placed on that occurring in the fall, while the chance of El Niño of any strength is around 80%.
.png)
Image: Ensemble forecast of SSTs in the Nino3.4 region (central equatorial Pacific), comprising the outputs of the major global numerical models and the mean (dotted line). Source: NOAA.
These intense El Niño events are relatively rare, occurring about every 10-15 years on average. The most recent examples of note were in 2015-16, 1997-98 and 1982-83.
Hurricane season
The most prominent impact of El Niño on the United States is on the hurricane season, because it induces a greater amount of wind shear (change in wind speed and/or direction with altitude) over the main development region (MDR) of the tropical North Atlantic. Conditions become less conducive to the formation of Atlantic hurricanes, and ordinarily hurricane numbers during El Niño tend to be quelled. Against that, very warm seas in the Gulf might serve to partly counteract that this year, and even if there are fewer hurricanes, there is always a risk of a major one developing, and landfalls can never be ruled out.
Temperatures and precipitation
Globally, the release of warmth from an El Niño episode can boost average temperatures and amplify weather anomalies, exacerbating heatwave, drought and wildfire risks in some parts of the world, including Australia and Indonesia, and causing the South Asian monsoon to falter. Other regions can suffer from elevated risks of catastrophic flooding. Super El Niño episodes can intensify or prolong these events.
However, there is not a consistent and clear link to summer temperatures across the United States, where impacts generally become more apparent through the winter.
During El Niño winters, the polar jet had a tendency to shift farther north, more often finding itself across Canada, while the subtropical Pacific jet also gets shunted farther north and extends more strongly eastwards. Broadly, this can result in a drier and milder than average winter across the northern US, and a wetter winter than usual throughout the south, with an enhanced storm track somewhat suppressed temperatures.
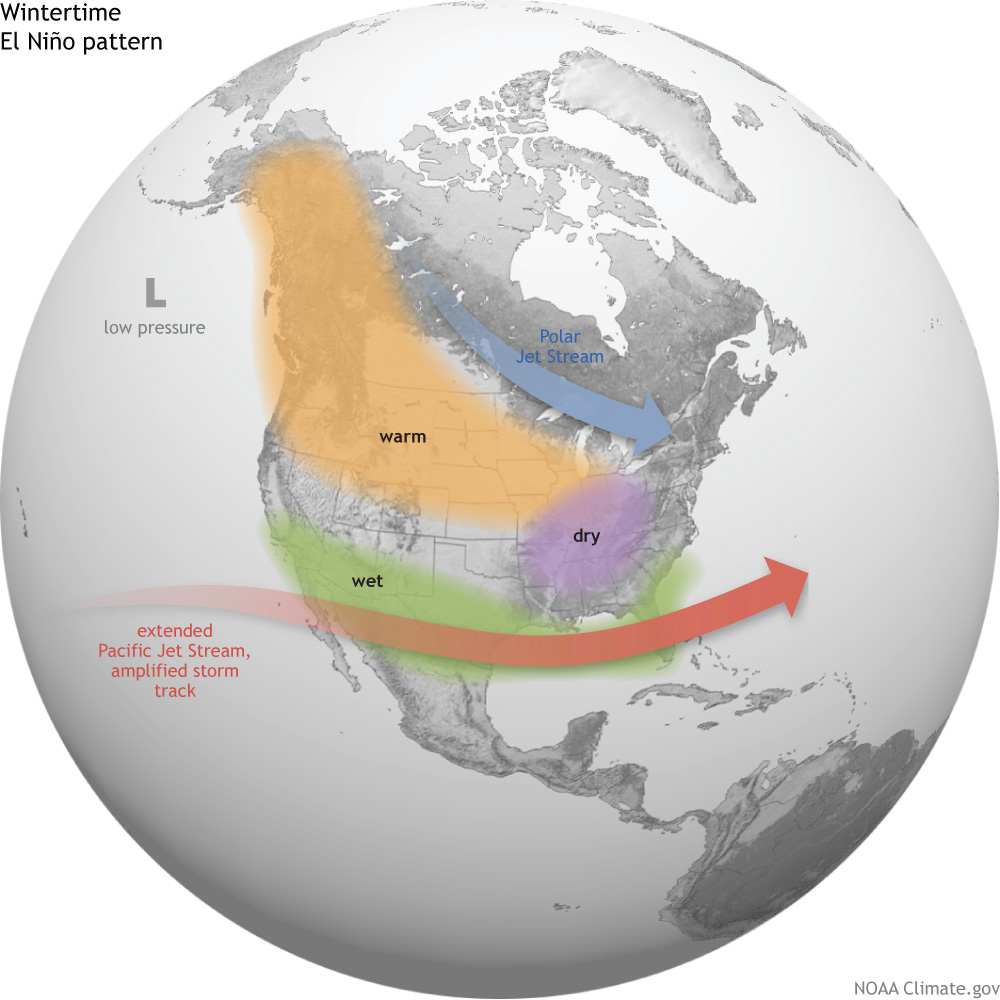
Image: Average location of the Pacific and Polar Jet Streams and typical temperature and precipitation impacts during the winter over North America. Source: Map by Fiona Martin for NOAA Climate.gov.
Shorter-term weather and climate drivers will always cause variations in the base pattern; but if El Niño develops as currently expected, and especially if a Super El Niño emerges, then we could be looking at a very different winter to the one we’ve just left behind.