Cool start to 2021 drives near-record low electricity demand
Mild temperatures and record installation of rooftop solar panels has led to near record lows in electricity demand in the National Electricity Market (NEM) for the first 3 months of this year (Q1). The electricity demand in Q1 was the lowest since 2002, with a three per cent drop in demand.1
AEMO Chief Markets Officer, Violette Mouchaileh, said: “Mild summer conditions have driven down both average and peak demand levels – average demand reduced by five per cent in New South Wales and three per cent in Queensland.” 1
The NEM wholesale electricity price fell by up to 68 per cent in Q1 2021, reaching the lowest averages since 2012.1
The near-record low electricity demand and abundant rooftop solar panels in South Australia, posed a new challenge for the market operators during Q1.
In fact, South Australia observed a near-record low in electricity demand due to mild temperatures and sunny conditions on Sunday 14 March 2021. At one point on Sunday, more the 70 per cent of the state's power came from rooftop solar panels alone. To stabilise the electricity grid, AEMO was forced to intervene, advising Electranet to switch off around 12,000 rooftop solar panels.
Who would have thought? Mild temperatures posing a challenge rather than extreme heat and prolonged heat waves.
So just how cool was summer 20/21 and Q1?
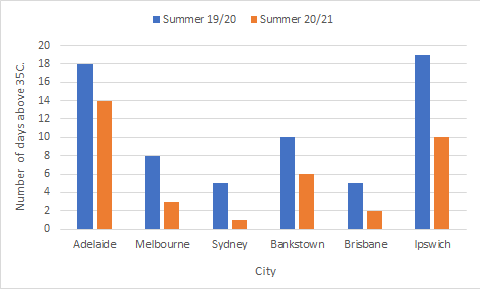
La Niña delivered the wettest and coolest summer in at least the last five years to much of Australia. South Australia saw its coolest summer (maximum temperatures) in 19 years, which was a relief for many South Australians after last summer's extreme heat. Last summer (2019/20), Adelaide saw a whopping 18 days (about 2 and a half weeks) above 35C, that’s four days more than this summer (figure 1). Ipswich also saw a significant reduction in the number of extreme heat days, with 9 days less than last summer (figure 1).

Figure 1: Number of days above 35C in each of the National Electricity Market’s capital cities.
Every capital city in the NEM saw a drop in the number of extreme heat days this summer compared to last summer, which is typical of La Niña.
The mild temperatures continued through the remainder of Q1 (1 January to 31 March 2021), with below average daytime temperatures experienced across the NEM. However, parts of Queensland saw above normal temperatures (figure 2)

Figure 2: BOM maximum temperature deciles 1 January to 31 March 2021.
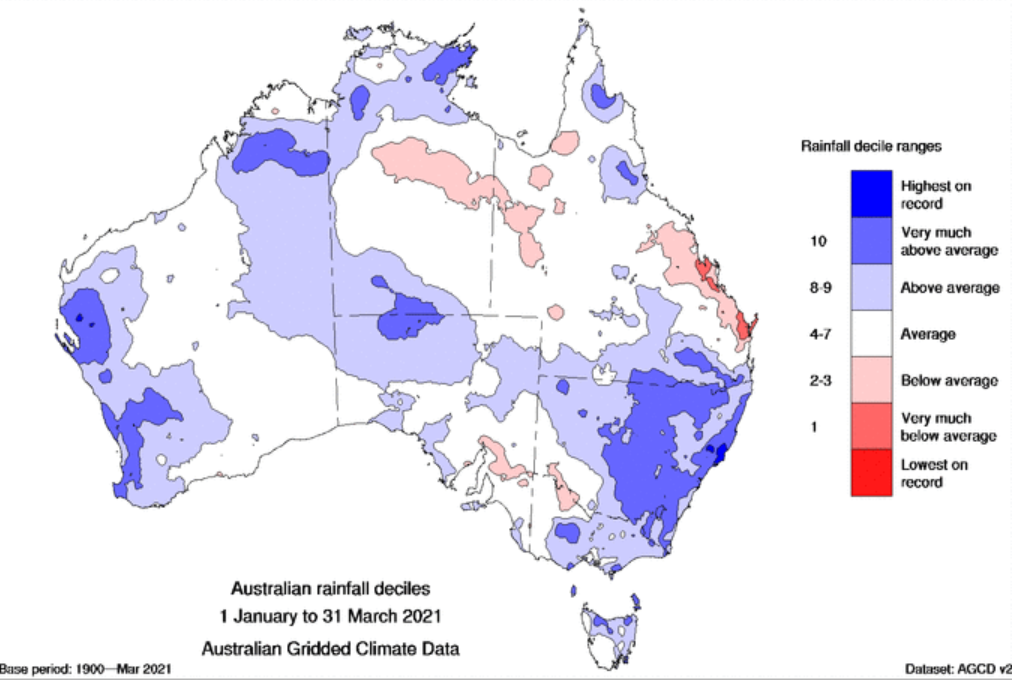
Rainfall and cloud in the first three months of this year were prevalent, with much of the NEM observing above average rain in Q1 (figure 3). The cloud and rainfall of course had a part to play in the mild Q1 temperatures.

Figure 3: BOM Australia rainfall deciles 1 January to 31 March 2021
Did Weatherzone predict the mild summer/Q1?
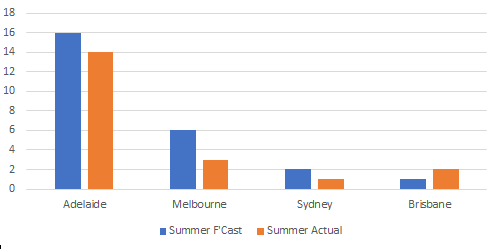
Weatherzone’s prediction of extreme heat days (days above 35C) gives an indication of quarterly heat extremes and the possible increases of electricity demand. The October 2020 forecast prior to summer indicated a reduction in extreme heat days and we saw this observed this summer and more (figure 4).

Figure 4: Weatherzone’s forecast verification of extreme heat days (Days>35C) for this summer (October forecast vs observations).
To find out more about Weatherzone's services for the energy industry, please contact us at business@weatherzone.com.au.
1 AEMO, Mild summer delivers near record low Q1 electricity demand and wholesale prices, https://aemo.com.au/newsroom/media-release/qed-q1-2021, 28/04/21.