
54.7 degrees of difference: a summary of summery extremes
Well, that was summer. Or something like it anyway.
In many places - and especially in our two most populous cities, Sydney and Melbourne - the Australian summer of 2020/21 felt nothing like the typical, hot Aussie summer that we're used to.
Indeed as we told you yesterday, the La Nina effect made it the coolest summer in nine years.
La Nina typically means a wetter summer than usual. Extra cloud tends to bring warmer nights but significantly cooler days, and so it proved this summer. This was of course a relief to many on the east coast after the smoke-filled inferno of the Black Summer of 2019/20.
But despite (and in some cases, because of) the La Nina effect, there were still some remarkable extremes across the country. Here’s a quick snapshot of some of the more interesting readings:
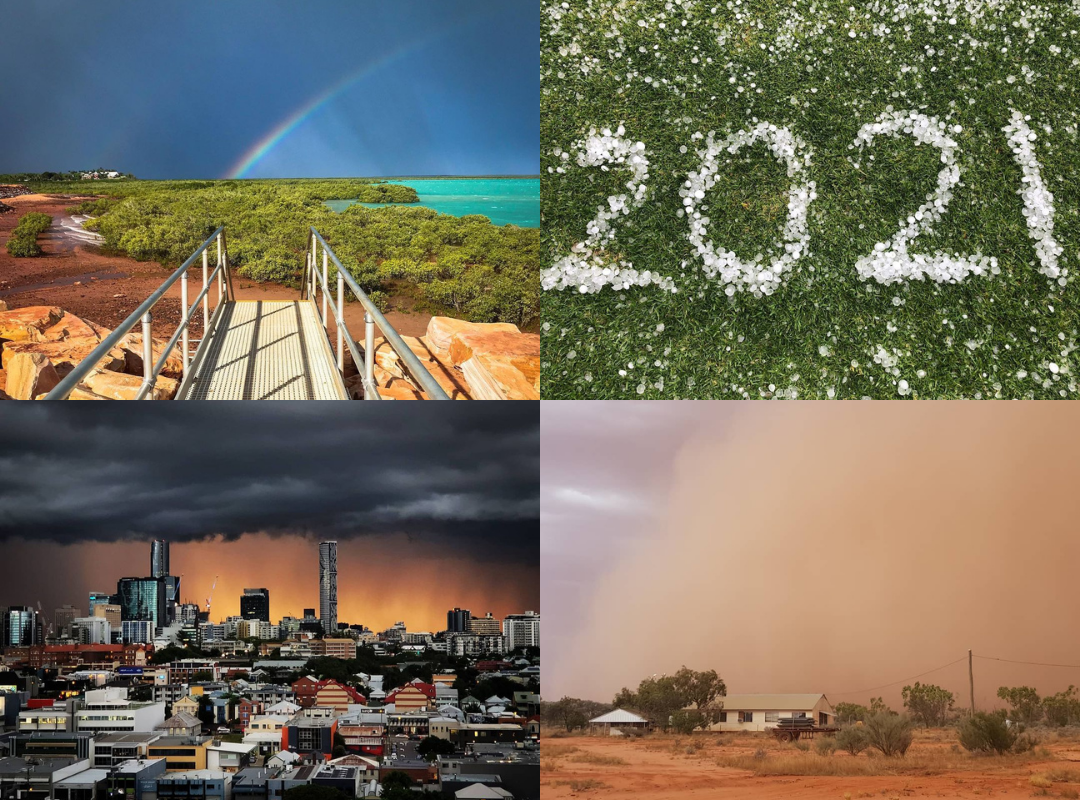
Image: Scenes from summer. Source (clockwise from top left: @slatts_snaps rainbow Broome WA, @elizabethgaye_ hail Broken Hill, @editfreephotography storm clouds Brisbane, @jesse_lee16 dust storm near Hungerford, SW QLD.
Overall
- The hottest temperature anywhere in Australia was 48.7°C at Birdsville Airport (Qld) on December 5.
- The coldest temperature anywhere was -6.0°C early in the morning of December 11 at Perisher Valley, NSW.
- The coldest daytime max was 1.9°C at the top of Thredbo, while the warmest night-time minimum was 33.3°C at Windorah Airport in Queensland, a tiny town east of Birdsville.
- That's a whopping difference of 54.7°C between the hottest and coldest readings anywhere in Australia for the summer of 2020/21.
- The wettest day was December 13 at Numinbah in southeast Queensland, with 456.0 mm of rain.
Now for some interesting stats from the summer of 2020/2021, going around the states.
NSW
- The New South Wales mean temp was 0.03°C above the 1961-1990 average. This made it the state's coolest summer since 2011/12.
- The wettest place was Yarras (Mount Seaview), just inland from Port Macquarie, with an incredible 1750.4 mm of rain. That was within 36mm of its ANNUAL average.
- Summer started with a bang, with Brewon AWS near Walgett reporting 48.0°C on December 1. This was the second-highest temperature ever recorded for December in New South Wales, and it turned out to be the highest temp of the summer anywhere in the state.
- Sydney daytime temps were 1-2°C below the longterm summer average.
ACT
- Mean maximum and minimum temperatures were both below average in the ACT.
- Canberra's hottest summer day was just 38°C. By comparison, the previous summer saw Canberra's hottest recorded day of 44°C.
VIC
- Rainfall was 14% above average overall across Victoria, with some sites recording their highest summer daily rainfall on record.
- Victoria recorded a cooler than average summer mean temperature for the first time since the summer of 2004/05.
- While parts of Melbourne topped 40°C, Melbourne's "official" weather station at Olympic Park did not top 40°C on any day this summer, and exceeded 35°C on only three days, all of them in January.
SA
- South Australia's average temp over summer was 0.48°C below the norm, which was the lowest since the summer of 2001/02.
- Total summer rainfall was 14% above average, the highest for four years.
- Adelaide only had one day when the temp reached 40°C all summer. That was on January 24, with a maximum of 42.7°C at Adelaide (West Terrace). Overall, the city's average max over summer was 27.4°C, which is 0.6°C below the long-term average of 28.0°C.
WA
- Western Australia's summer rainfall was nearly 50% above average, making it the wettest summer in three years.
- The average summer maximum temp was 0.53 °C below average - the coolest since 2005/06.
- Perth Metro recorded a summer total of 43.2mm of rainfall, which was slightly higher than average. The bulk of that rain came from a tropical low which drifted south, producing steady falls on February 7 and 8 and helping douse the serious bushfires on the eastern fringe of the city.
QLD
- Queensland bucked the national trend for cooler than average temperatures, with an average temp 0.85°C above average. Despite this, it was still the coolest summer since 2011-12, a statistic which really emphasises the strong overall warming trend in Australia.
- No tropical cyclones were recorded that produced serious damage, though TC Imogen did make landfall in the Gulf region in January with gusts of 100 km/h.
- Summer temps were close to average in Brisbane.
NT
- Darwin had a much wetter summer than usual, thanks mainly to rainfall of 616.8mm in January, which was nearly 50% above the monthly average.
TAS
- Summer rainfall was 19% above average for the state overall, the highest in a decade (the summer of 2010/11 was also a strong La Nina summer).
- Average mins and maximum temps were both marginally below average for the state as a whole.
- Summer extremes across the state ranged from 38°C to -4°C